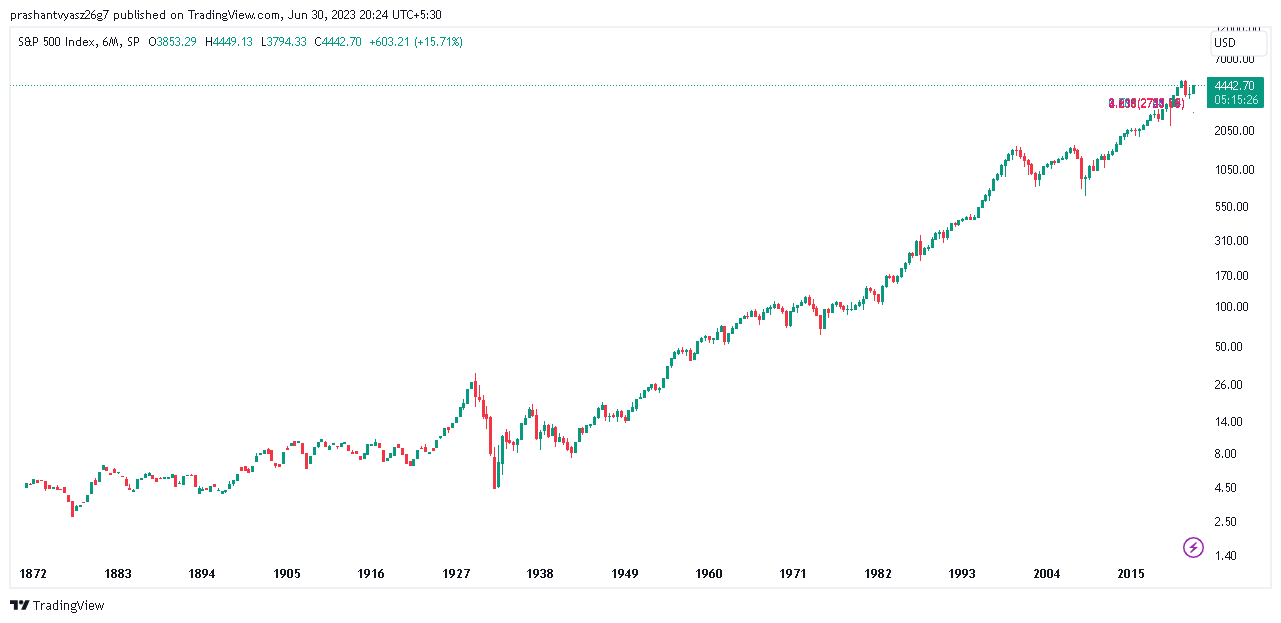
One of the most popular equity indices, the Standard & Poor’s Index, was created in 1926 to reflect the performance of the top 500 Largest US Stock Market companies. In the last 95 years (1926 – 2023), the S&P 500 Historical Annual Return is around 10% to 11%, the inflation-adjusted returns are near 7% and the dividend-reinvested return is close to 12%.
| S&P 500 | Annual Cumulative Return |
|---|---|
| YTD | + 13.23% (2023) |
| 1 Year | – 19.44% (2022) |
| Last 5 Years | + 43.86% (2018 – 2022) |
| Last 10 Years | + 169.47% (2013 – 2022) |
| Last 20 Years | + 336.27% (2003 – 2022) |
| Last 30 Years | + 781.61% (1993 – 2022) |
| Biggest Gain | +38.06% (1958) |
| Biggest Fall | – 38.49% (2008) |
| Average Annual Return | +10% to +11% |
Based on the calculation if you invested $1000 in the SPX 500 during Jan of 1990, it would have grown to approximately $21,478 by the End of 2022 (Dividends Reinvested).
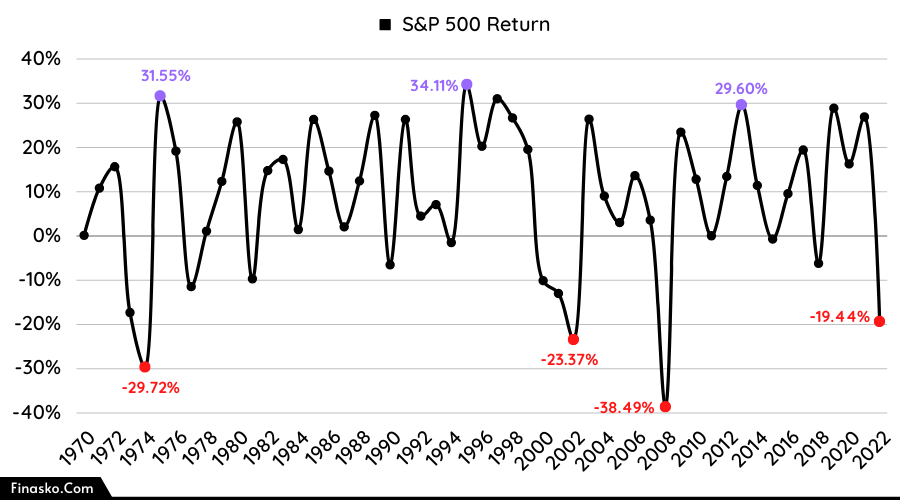
S&P 500 Annual Return By Year (1930 to 2023)
In the below chart, you can quickly check the Historical Annual Return of the S&P 500 index (Including both price returns and re-invested dividends) from 1930 to 2023:
| YEAR | TOTAL RETURN |
|---|---|
| 2023 | 13.23% (Till 22nd Sep. 2023) |
| 2022 | -18.11% |
| 2021 | 28.71% |
| 2020 | 18.40% |
| 2019 | 31.49% |
| 2018 | -4.38% |
| 2017 | 21.83% |
| 2016 | 11.96% |
| 2015 | 1.38% |
| 2014 | 13.69% |
| 2013 | 32.39% |
| 2012 | 16.00% |
| 2011 | 2.11% |
| 2010 | 15.06% |
| 2009 | 26.46% |
| 2008 | -37.00% |
| 2007 | 5.49% |
| 2006 | 15.79% |
| 2005 | 4.91% |
| 2004 | 10.88% |
| 2003 | 28.68% |
| 2002 | -22.10% |
| 2001 | -11.89% |
| 2000 | -9.10% |
| 1999 | 21.04% |
| 1998 | 28.58% |
| 1997 | 33.36% |
| 1996 | 22.96% |
| 1995 | 37.58% |
| 1994 | 1.32% |
| 1993 | 10.08% |
| 1992 | 7.62% |
| 1991 | 30.47% |
| 1990 | -3.10% |
| 1989 | 31.69% |
| 1988 | 16.61% |
| 1987 | 5.25% |
| 1986 | 18.67% |
| 1985 | 31.73% |
| 1984 | 6.27% |
| 1983 | 22.56% |
| 1982 | 21.55% |
| 1981 | -4.91% |
| 1980 | 32.42% |
| 1979 | 18.44% |
| 1978 | 6.56% |
| 1977 | -7.18% |
| 1976 | 23.84% |
| 1975 | 37.20% |
| 1974 | -26.47% |
| 1973 | -14.66% |
| 1972 | 18.98% |
| 1971 | 14.31% |
| 1970 | 4.01% |
| 1969 | -8.50% |
| 1968 | 11.06% |
| 1967 | 23.98% |
| 1966 | -10.06% |
| 1965 | 12.45% |
| 1964 | 16.48% |
| 1963 | 22.80% |
| 1962 | -8.73% |
| 1961 | 26.89% |
| 1960 | 0.47% |
| 1959 | 11.96% |
| 1958 | 43.36% |
| 1957 | -10.78% |
| 1956 | 6.56% |
| 1955 | 31.56% |
| 1954 | 52.62% |
| 1953 | -0.99% |
| 1952 | 18.37% |
| 1951 | 24.02% |
| 1950 | 31.71% |
| 1949 | 18.79% |
| 1948 | 5.50% |
| 1947 | 5.71% |
| 1946 | -8.07% |
| 1945 | 36.44% |
| 1944 | 19.75% |
| 1943 | 25.90% |
| 1942 | 20.34% |
| 1941 | -11.59% |
| 1940 | -9.78% |
| 1939 | -0.41% |
| 1938 | 31.12% |
| 1937 | -35.03% |
| 1936 | 33.92% |
| 1935 | 47.67% |
| 1934 | -1.44% |
| 1933 | 53.99% |
| 1932 | -8.19% |
| 1931 | -43.34% |
| 1930 | -24.90% |
S&P 500 Return By Month (2022-2023)
Here is the monthly return of the S&P 500 Index.
| Date | SPX Return |
|---|---|
| August 2023 | -1.77% |
| July 2023 | +3.11% |
| June 2023 | +6.47% |
| May 2023 | +0.25% |
| April 2023 | +1.46% |
| March 2023 | +3.51% |
| February 2023 | -2.61% |
| January 2023 | 5.28% |
| December 2022 | -5.90% |
| November 2022 | 5.38% |
| October 2022 | 7.99% |
| September 2022 | -9.34% |
| August 2022 | -4.24% |
| July 2022 | 9.11% |
| June 2022 | -8.39% |
| May 2022 | 0.01% |
| April 2022 | -8.80% |
| March 2022 | 3.58% |
| February 2022 | -3.14% |
Is S&P 500 a Good investment?
The S&P 500 (SPX) is an index of the 500 largest companies in the U.S., weighted by market capitalization – Including many large, brand-name companies like Alphabet (Google), JPMorgan Chase, Amazon, Exxon Mobil, Tesla, and Apple.
According to a 2020 report, over 15 years, nearly 90% of actively managed investment funds failed to beat the index funds or market. However, it is a safe & diversified investment that has historically kept it secure from too much market fluctuation and provides good returns in the long run.
Also, many experts say that beginner or individual investors can start an investment journey with S&P 500 Index Funds and improve their portfolio’s stability.
S&P 500 Vs. Nasdaq 100
No doubt that the Nasdaq 100 Return outperformed the S&P 500 and Dow Jones Performance, but you can see in the below chart that the risk is also increased with the reward –
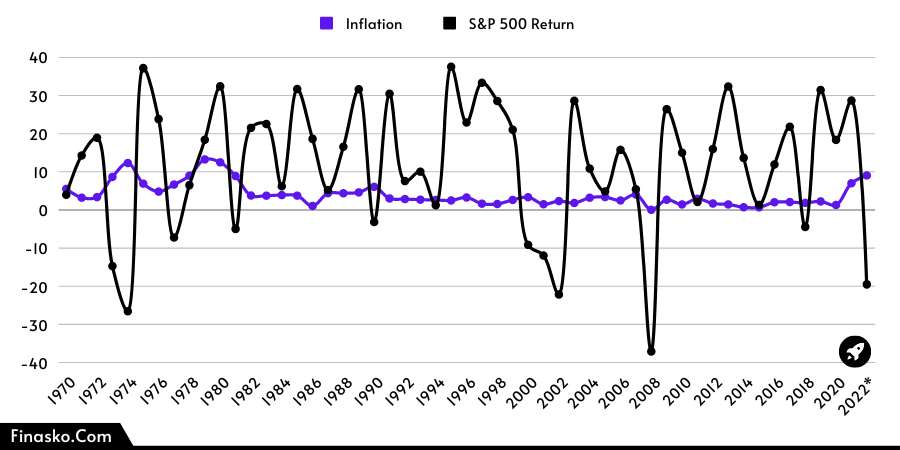
What Affects the S&P 500 Returns?
Generally, three things can affect the SPX/Stock Market Returns –
#1 Inflation: Investors can use historical data to identify How Inflation Affects The Stock Market. When comparing the actual returns against nominal returns, investors can see how inflation reduces returns. For example, instead of being 10% of the average return, the CPI-adjusted average return falls to 7%.
#2 Timing: You’ve decided to invest in stocks and ETFs. That’s an important step, but your investment strategy has one more thing to consider: timing and entry points affect the returns. A new study shows that the best timings make up 50% more profit.
For Example, – An investor who bought between 2017 and 2019 and sold in the 2020 (Covid) recession has experienced lousy performance. Still, those who invest or average during the market bottom have great portfolio returns.
Are We In A Recession? Check Out In 1-Minute
How to Identify the Best Time to Enter In the Stock Market?
So you can use a few market valuation indicators like S&P 500 PE Ratio, Buffet Indicator, and Shiller PE Ratio. That helps investors & traders understand whether the stock market is undervalued or overvalued.
#3 Capital Gain Tax: Usually, if you buy any stock or ETF and sell with profit under 12 12-month period, you will be eligible for short-term capital gain tax, which is usually higher than Long-term capital gains tax rates. So think about long-term investment. You can get help from this “How to Pay Less” article and understand how to save more.
FAQ’s
Q. S&P 500 Annual Returns Last 10 Years?
The SP 500’s past 10 years’ average return is near 17% and the cumulative return is 169.47%. Speaking of returns over the previous 100 years, the average return is around 10% – 11%, with inflation-adjusted returns of 7%.
Q. Does the S&P 500 Index Pay Dividend?
Yes. Many companies in the index provide dividends; you can find out by index dividend yield. And if you want to know which companies pay regular dividends, you can track dividend aristocrats and dividend kings.
Q. How to Invest in S&P 500 Index?
S&P 500 ETF (Exchange Trade Fund) is the best way to invest in an Index. They have a low expense ratio, the same return as an index, and are tradable like stocks. But before choosing any instrument to invest in S&P 500, make sure you know the pros and cons of each method because these instruments have their advantages and demerits.
Disclaimer ✋
The information included on this site is for educational purposes and is not intended as a substitute for investment advice. Data on past performance, where given, is not necessarily a guide to future performance. So before investing, you should carefully consider the Fund’s investment objectives, risks, charges, and expenses.
Therefore what is the actual return for the past five years
The last 5 year return of S&P 500 (2018-2022) is near 45% and the average annual return is 9%