The technology industry is one of the most significant and rapidly growing sectors globally. The top 100 tech companies have an estimated worth of over $15 trillion.
The most valuable technology companies, such as Apple, Amazon, Microsoft, Google, and Facebook, are now household names. The so-called “Big 5” tech companies have established a global presence, with many other major companies dependent on their products and services to remain competitive.
These companies not only create jobs but also have a significant impact on the lives of billions of people and will continue to shape society as we know it. As a result, more and more individuals are seeking career opportunities in this expanding industry.
Top 100 Most Valuable Tech Companies
| # | Stock | Marketcap | Price | Change % | Country | Open | High | Low | Close | Volume | Sector | 52 Week Range | EPS | Dividend Rate | Dividend Yield |
|---|---|---|---|---|---|---|---|---|---|---|---|---|---|---|---|
| 1 |  Apple Inc. AAPL | 2.6T | $169.4 | 1.92% | $171.7 | $173.8 | $168.3 | $172.7 | 72,646,896 | 6.4 | 1.0 | 0.6% | |||
| 2 |  Microsoft Corporation MSFT | 3.1T | $414.6 | 0.23% | $414.5 | $418.4 | $413.7 | $413.6 | 16,701,613 | 11.1 | 2.9 | 0.7% | |||
| 3 |  Alphabet Inc. GOOG | 1.9T | $156.0 | 0.21% | $155.8 | $157.2 | $155.1 | $156.3 | 15,166,163 | 5.8 | 0.0 | 0.0% | |||
| 4 |  Amazon.com, Inc. AMZN | 1.9T | $183.3 | 0.16% | $183.2 | $184.8 | $182.3 | $183.6 | 32,785,898 | 2.9 | 0.0 | 0.0% | |||
| 5 |  Tesla, Inc. TSLA | 500.4B | $157.1 | 2.71% | $156.7 | $158.2 | $153.8 | $161.5 | 96,497,376 | 4.3 | 0.0 | 0.0% | |||
| 6 |  NVIDIA Corporation NVDA | 2.2T | $874.2 | 1.64% | $864.9 | $881.1 | $860.7 | $860.0 | 36,769,044 | 11.9 | 0.2 | 0.0% | |||
| 7 | TENCENT HOLDINGS LIMITED UNSP A TCEHY | 363.1B | $38.4 | 0.23% | $38.4 | $38.6 | $38.3 | $38.5 | 2,379,508 | 1.6 | 3.1 | 8.0% | |||
| 8 |  Taiwan Semiconductor Manufactur TSM | 725.1B | $139.8 | 0.24% | $137.9 | $140.5 | $137.1 | $140.1 | 14,031,268 | 5.0 | 13.0 | 9.3% | |||
| 9 |  Meta Platforms, Inc. META | 1.3T | $499.8 | 0.09% | $498.8 | $504.7 | $497.1 | $500.2 | 9,815,332 | 14.9 | 0.0 | 0.0% | |||
| 10 |  SamsungElec 005930.KS | 0.3782T | $56.8 | 1.38% | $58.1 | $58.2 | $56.8 | $57.6 | 22,611,631 | 0.0 | 0.0 | 0.0% | |||
| 11 |  Alibaba Group Holding Limited BABA | 170.2B | $69.6 | 1.43% | $70.0 | $70.3 | $69.3 | $70.6 | 17,403,738 | 5.4 | 6.9 | 9.7% | |||
| 12 |  ASML Holding N.V. - New York Re ASML | 385.5B | $976.9 | 2.31% | $985.4 | $978.6 | $957.2 | $954.8 | 1,247,412 | 21.2 | 6.1 | 0.6% | |||
| 13 |  Broadcom Inc. AVGO | 615.9B | $1,329.1 | 1.40% | $1,316.0 | $1,336.3 | $1,311.0 | $1,310.7 | 1,846,682 | 27.0 | 19.7 | 1.5% | |||
| 14 |  Oracle Corporation ORCL | 331.5B | $120.6 | 0.62% | $120.1 | $121.4 | $119.8 | $119.9 | 6,979,042 | 3.8 | 1.6 | 1.3% | |||
| 15 |  Cisco Systems, Inc. CSCO | 194.0B | $47.9 | 0.66% | $48.5 | $48.5 | $47.8 | $48.2 | 13,939,667 | 3.3 | 1.6 | 3.2% | |||
| 16 |  Adobe Inc. ADBE | 213.3B | $476.2 | 1.30% | $470.0 | $479.0 | $468.5 | $470.1 | 2,658,505 | 10.5 | 0.0 | 0.0% | |||
| 17 |  Salesforce, Inc. CRM | 269.1B | $277.4 | 1.65% | $274.8 | $280.6 | $272.4 | $272.9 | 7,609,934 | 4.2 | 0.0 | 0.0% | |||
| 18 |  Netflix, Inc. NFLX | 267.2B | $617.5 | 1.71% | $607.5 | $622.5 | $607.5 | $607.2 | 3,504,748 | 12.0 | 0.0 | 0.0% | |||
| 19 |  Texas Instruments Incorporated TXN | 152.5B | $167.6 | 0.75% | $167.5 | $168.5 | $166.8 | $166.4 | 3,388,902 | 7.1 | 5.0 | 3.0% | |||
| 20 |  QUALCOMM Incorporated QCOM | 188.1B | $168.6 | 0.74% | $169.3 | $169.6 | $167.5 | $169.8 | 6,385,085 | 7.0 | 3.2 | 1.9% | |||
| 21 | MEITUAN UNSPON ADS EACH REP 2 O MPNGY | 78.2B | $25.0 | 1.80% | $25.2 | $25.3 | $25.0 | $25.5 | 231,603 | 0.6 | 0.0 | 0.0% | |||
| 22 |  SAP SE SAP | 211.3B | $180.6 | 0.18% | $181.5 | $182.3 | $180.1 | $180.2 | 783,539 | 3.3 | 2.2 | 1.2% | |||
| 23 |  PDD Holdings Inc. PDD | 150.8B | $113.5 | 0.67% | $112.9 | $115.5 | $111.9 | $114.3 | 5,148,061 | 5.7 | 0.0 | 0.0% | |||
| 24 |  Advanced Micro Devices, Inc. AMD | 264.2B | $163.5 | 1.96% | $162.3 | $164.9 | $161.7 | $160.3 | 55,037,959 | 0.5 | 0.0 | 0.0% | |||
| 25 |  International Business Machines IBM | 168.5B | $183.8 | 1.38% | $185.6 | $185.7 | $182.9 | $181.3 | 4,472,570 | 8.2 | 6.6 | 3.7% | |||
| 26 |  Intuit Inc. INTU | 171.2B | $611.5 | 0.10% | $613.7 | $618.5 | $610.9 | $612.1 | 1,107,848 | 9.8 | 3.4 | 0.5% | |||
| 27 |  JD.com, Inc. JD | 39.7B | $25.1 | 1.42% | $25.0 | $25.4 | $24.7 | $25.4 | 7,491,594 | 2.1 | 5.4 | 21.2% | |||
| 28 |  KEYENCE CORP 6861.T | 0.101T | $416.6 | 1.47% | $421.4 | $422.3 | $413.5 | $422.8 | 442,100 | 1.5K | 300.0 | 0.5% | |||
| 29 |  Sony Group Corporation SONY | 102.4B | $83.0 | 0.81% | $83.5 | $83.6 | $82.9 | $82.3 | 760,899 | 4.5 | 80.0 | 97.2% | |||
| 30 | Booking Holdings Inc. Common St BKNG | 118.5B | $3,467.8 | 0.51% | $3,583.1 | $3,497.5 | $3,450.8 | $3,485.6 | 210,907 | 117.5 | 0.0 | 0.0% | |||
| 31 | Applied Materials, Inc. AMAT | 174.1B | $209.5 | 1.85% | $206.3 | $210.4 | $205.8 | $205.7 | 3,696,713 | 8.5 | 1.3 | 0.6% | |||
| 32 |  PayPal Holdings, Inc. PYPL | 66.8B | $63.4 | 0.13% | $63.0 | $64.2 | $62.9 | $63.5 | 9,848,221 | 3.8 | 0.0 | 0.0% | |||
| 33 |  ServiceNow, Inc. NOW | 153.0B | $744.8 | 1.22% | $738.0 | $749.0 | $735.3 | $735.8 | 1,085,285 | 8.4 | 0.0 | 0.0% | |||
| 34 | Automatic Data Processing, Inc. ADP | 100.3B | $244.2 | 0.05% | $245.0 | $245.5 | $243.4 | $244.1 | 1,395,726 | 8.6 | 5.2 | 2.1% | |||
| 35 | SCHNEIDER ELECTRIC SE SU.PA | 125.8B | $225.3 | 1.58% | $220.9 | $226.4 | $220.9 | $221.8 | 168,107 | 7.1 | 3.5 | 1.7% | |||
| 36 | Analog Devices, Inc. ADI | 94.8B | $191.2 | 0.49% | $195.0 | $194.0 | $190.5 | $190.3 | 2,259,345 | 5.6 | 3.5 | 1.8% | |||
| 37 | Airbnb, Inc. ABNB | 99.9B | $156.7 | 0.68% | $155.3 | $158.9 | $155.3 | $155.6 | 2,723,159 | 7.2 | 0.0 | 0.0% | |||
| 38 | Micron Technology, Inc. MU | 134.8B | $121.8 | 0.33% | $119.5 | $122.5 | $118.4 | $121.4 | 17,296,648 | 3.4 | 0.5 | 0.4% | |||
| 39 |  Fiserv, Inc. FISV | 0.0000 | $114.2 | 0.00% | $112.5 | $114.2 | $114.2 | $114.2 | 20,051,164 | 0.0 | 0.0 | 0.0% | |||
| 40 |  Equinix, Inc. EQIX | 70.4B | $742.1 | 0.26% | $761.2 | $747.1 | $733.3 | $744.1 | 579,902 | 10.3 | 14.5 | 1.9% | |||
| 41 |  Lam Research Corporation LRCX | 126.3B | $963.2 | 1.80% | $948.8 | $966.3 | $946.8 | $946.2 | 542,391 | 25.9 | 7.5 | 0.8% | |||
| 42 | Shopify Inc. SHOP | 88.4B | $68.7 | 0.19% | $68.5 | $69.3 | $68.0 | $68.6 | 9,204,166 | 0.1 | 0.0 | 0.0% | |||
| 43 | MercadoLibre, Inc. MELI | 70.9B | $1,397.9 | 1.27% | $1,466.4 | $1,419.9 | $1,396.7 | $1,415.9 | 362,806 | 19.4 | 0.0 | 0.0% | |||
| 44 |  Uber Technologies, Inc. UBER | 154.3B | $74.1 | 0.99% | $73.4 | $74.7 | $72.7 | $73.4 | 14,490,015 | 0.9 | 0.0 | 0.0% | |||
| 45 | NetEase, Inc. NTES | 58.6B | $90.4 | 1.90% | $91.5 | $91.7 | $90.1 | $92.2 | 1,666,807 | 6.3 | 18.2 | 19.7% | |||
| 46 |  KLA Corporation KLAC | 93.8B | $693.3 | 2.18% | $689.9 | $696.9 | $678.5 | $678.5 | 917,859 | 19.8 | 5.4 | 0.8% | |||
| 47 |  TOKYO ELECTRON 8035.T | 0.1119T | $241.8 | 0.98% | $247.1 | $249.9 | $241.7 | $244.2 | 4,104,300 | 764.5 | 366.0 | 1.0% | |||
| 48 | Synopsys, Inc. SNPS | 82.5B | $541.1 | 0.52% | $542.5 | $544.6 | $539.3 | $543.9 | 895,433 | 9.0 | 0.0 | 0.0% | |||
| 49 | Snowflake Inc. SNOW | 50.2B | $150.3 | 1.11% | $151.5 | $152.1 | $149.1 | $152.0 | 4,521,098 | 2.6 | 0.0 | 0.0% | |||
| 50 |  NINTENDO CO LTD 7974.T | 0.0573T | $49.2 | 0.81% | $49.5 | $49.6 | $48.7 | $48.8 | 3,395,400 | 425.1 | 203.0 | 2.7% | |||
| 51 | SK hynix 000660.KS | 0.0886T | $128.7 | 0.22% | $129.4 | $131.5 | $128.0 | $129.0 | 4,340,591 | 0.0 | 0.0 | 0.0% | |||
| 52 |  Cadence Design Systems, Inc. CDNS | 82.0B | $300.8 | 0.25% | $298.9 | $302.0 | $296.6 | $301.6 | 1,650,886 | 3.8 | 0.0 | 0.0% | |||
| 53 | INFINEON TECH.AG NA O.N. IFX.DE | 44.0B | $33.7 | 1.03% | $33.6 | $34.1 | $33.5 | $34.1 | 1,016,559 | 2.3 | 0.4 | 1.1% | |||
| 54 | Block, Inc. SQ | 45.0B | $73.1 | 0.49% | $72.4 | $74.2 | $72.1 | $73.5 | 5,635,959 | 0.0 | 0.0 | 0.0% | |||
| 55 | Palo Alto Networks, Inc. PANW | 88.9B | $275.0 | 1.05% | $270.4 | $276.5 | $270.4 | $272.2 | 3,625,327 | 6.5 | 0.0 | 0.0% | |||
| 56 |  DASSAULT SYSTEMES DSY.PA | 53.7B | $40.9 | 0.85% | $41.0 | $41.2 | $40.9 | $41.3 | 236,807 | 0.8 | 0.2 | 0.6% | |||
| 57 |  Baidu, Inc. BIDU | 33.7B | $96.1 | 0.09% | $95.9 | $96.9 | $94.6 | $96.2 | 3,113,108 | 7.6 | 0.0 | 0.0% | |||
| 58 | NXP Semiconductors N.V. NXPI | 59.1B | $230.7 | 0.25% | $231.6 | $232.5 | $228.0 | $230.1 | 1,635,003 | 10.7 | 4.1 | 1.8% | |||
| 59 | ADYEN ADYEN.AS | 47.4B | $1,528.2 | 0.46% | $1,518.6 | $1,538.6 | $1,516.3 | $1,521.1 | 15,333 | 22.5 | 0.0 | 0.0% | |||
| 60 |  Roper Technologies, Inc. ROP | 56.4B | $527.0 | 0.24% | $531.0 | $532.2 | $527.0 | $528.3 | 335,896 | 12.8 | 2.8 | 0.5% | |||
| 61 |  Workday, Inc. WDAY | 68.1B | $257.7 | 0.75% | $259.7 | $260.1 | $256.7 | $259.6 | 2,051,978 | 5.2 | 0.0 | 0.0% | |||
| 62 | Autodesk, Inc. ADSK | 48.8B | $228.2 | 0.60% | $240.0 | $230.4 | $227.6 | $229.6 | 2,087,536 | 4.2 | 0.0 | 0.0% | |||
| 63 |  HON HAI PRECISION INDUSTRY 2317.TW | 0.0627T | $4.5 | 3.90% | $4.4 | $4.6 | $4.4 | $4.4 | 105,566,546 | 10.1 | 5.4 | 3.8% | |||
| 64 | Fidelity National Information S FIS | 40.8B | $70.7 | 0.03% | $70.9 | $71.4 | $70.5 | $70.7 | 2,710,318 | 0.9 | 2.1 | 2.9% | |||
| 65 | STMicroelectronics N.V. STM | 37.2B | $40.3 | 0.76% | $40.3 | $40.6 | $40.1 | $40.6 | 4,223,674 | 4.5 | 0.2 | 0.6% | |||
| 66 |  XIAOMI CORPORATION XIACF | 50.7B | $2.1 | 1.91% | $2.0 | $2.2 | $2.0 | $2.1 | 86,892 | 0.1 | 0.0 | 0.0% | |||
| 67 | Microchip Technology Incorporat MCHP | 46.4B | $85.9 | 0.27% | $86.1 | $86.9 | $85.5 | $85.7 | 3,438,783 | 4.3 | 1.6 | 1.9% | |||
| 68 | IQVIA Holdings, Inc. IQV | 41.7B | $229.1 | 0.87% | $232.3 | $232.6 | $228.8 | $231.2 | 920,952 | 7.3 | 0.0 | 0.0% | |||
| 69 | Atlassian Corporation TEAM | 50.5B | $194.9 | 1.57% | $191.3 | $195.5 | $191.2 | $191.8 | 2,376,175 | 1.5 | 0.0 | 0.0% | |||
| 70 | Fortinet, Inc. FTNT | 49.2B | $64.5 | 0.39% | $67.0 | $65.6 | $64.3 | $64.7 | 2,917,393 | 1.5 | 0.0 | 0.0% | |||
| 71 |  KUAISHOU-W 1024.HK | 25.3B | $5.8 | 3.08% | $6.0 | $6.1 | $5.7 | $6.0 | 21,892,386 | 1.6 | 0.0 | 0.0% | |||
| 72 | TE Connectivity Ltd. New Switze TEL | 44.1B | $142.9 | 0.58% | $142.1 | $144.0 | $141.8 | $142.0 | 1,794,439 | 10.5 | 2.3 | 1.6% | |||
| 73 | Arista Networks, Inc. ANET | 82.1B | $262.8 | 0.17% | $264.0 | $267.2 | $262.0 | $263.2 | 2,209,085 | 6.6 | 0.0 | 0.0% | |||
| 74 | Sea Limited SE | 32.1B | $56.4 | 6.94% | $52.0 | $57.2 | $51.7 | $52.7 | 13,018,069 | 0.3 | 0.0 | 0.0% | |||
| 75 | Marvell Technology, Inc. MRVL | 59.1B | $68.3 | 0.59% | $67.3 | $69.0 | $67.1 | $67.9 | 8,527,717 | 1.1 | 0.2 | 0.4% | |||
| 76 | CONSTELLATION SOFTWARE INC. CSU.TO | 56.1B | $2,647.2 | 1.66% | $2,603.1 | $2,665.1 | $2,603.1 | $2,603.9 | 32,187 | 36.9 | 4.0 | 0.1% | |||
| 77 | MEDIATEK INC 2454.TW | 0.0516T | $32.4 | 0.47% | $32.9 | $33.2 | $32.2 | $32.6 | 8,117,248 | 48.3 | 55.0 | 5.2% | |||
| 78 | MURATA MANUFACTURING CO 6981.T | 0.0342T | $18.1 | 1.06% | $18.3 | $18.3 | $18.0 | $18.3 | 4,196,000 | 114.1 | 50.0 | 1.8% | |||
| 79 | Electronic Arts Inc. EA | 33.8B | $126.6 | 0.39% | $127.7 | $128.8 | $126.4 | $127.1 | 1,899,368 | 4.0 | 0.8 | 0.6% | |||
| 80 |  GlobalFoundries Inc. GFS | 26.4B | $47.8 | 1.14% | $50.2 | $48.5 | $47.0 | $47.3 | 1,175,765 | 1.8 | 0.0 | 0.0% | |||
| 81 |  ON Semiconductor Corporation ON | 27.8B | $64.7 | 1.40% | $65.4 | $65.5 | $64.1 | $65.6 | 5,212,396 | 4.9 | 0.0 | 0.0% | |||
| 82 | Keysight Technologies Inc. KEYS | 26.5B | $151.6 | 1.12% | $153.2 | $153.3 | $150.6 | $153.3 | 940,796 | 5.4 | 0.0 | 0.0% | |||
| 83 | CoStar Group, Inc. CSGP | 35.2B | $86.3 | 1.42% | $87.4 | $87.7 | $85.7 | $87.5 | 2,525,169 | 0.9 | 0.0 | 0.0% | |||
| 84 | Global Payments Inc. GPN | 31.5B | $123.4 | 0.21% | $123.2 | $124.8 | $122.8 | $123.2 | 1,542,243 | 3.8 | 1.0 | 0.8% | |||
| 85 | Coupang, Inc. CPNG | 40.1B | $22.5 | 3.97% | $21.3 | $22.8 | $21.3 | $21.7 | 25,870,738 | 0.8 | 0.0 | 0.0% | |||
| 86 | Dell Technologies Inc. DELL | 86.4B | $121.1 | 2.78% | $116.7 | $121.7 | $115.7 | $117.8 | 6,568,529 | 4.4 | 1.5 | 1.3% | |||
| 87 |  HP Inc. HPQ | 27.2B | $27.8 | 0.61% | $28.0 | $28.0 | $27.6 | $28.0 | 6,747,324 | 3.4 | 1.1 | 3.8% | |||
| 88 | Mobileye Global Inc. MBLY | 24.3B | $30.1 | 3.89% | $31.0 | $31.1 | $30.1 | $31.4 | 2,783,367 | 0.0 | 0.0 | 0.0% | |||
| 89 | AMADEUS IT GROUP, S.A. AMS.MC | 26.1B | $59.8 | 0.43% | $59.1 | $59.9 | $59.0 | $59.6 | 96,846 | 2.4 | 1.2 | 2.2% | |||
| 90 | JD HEALTH 6618.HK | 9.4B | $3.0 | 0.65% | $3.0 | $3.0 | $2.9 | $3.0 | 4,903,536 | 0.7 | 0.0 | 0.0% | |||
| 91 | Enphase Energy, Inc. ENPH | 15.0B | $110.5 | 1.78% | $116.5 | $112.3 | $108.7 | $112.5 | 2,901,484 | 3.1 | 0.0 | 0.0% | |||
| 92 | WOLTERS KLUWER NAM. EO-12 WOSB.F | 36.0B | $150.9 | 0.18% | $149.7 | $150.9 | $149.7 | $150.7 | 60 | 4.1 | 2.1 | 1.5% | |||
| 93 |  Veeva Systems Inc. VEEV | 32.3B | $200.4 | 0.62% | $200.9 | $202.6 | $199.5 | $201.6 | 1,409,227 | 3.2 | 0.0 | 0.0% | |||
| 94 | SEMICONDUCTOR MAN.INTL MKN2.F | 23.4B | $1.9 | 6.67% | $1.8 | $1.9 | $1.8 | $1.8 | 1,800 | 0.1 | 0.0 | 0.0% | |||
| 95 | eBay Inc. EBAY | 26.0B | $50.3 | 1.26% | $50.7 | $50.8 | $49.9 | $50.9 | 5,120,579 | 5.2 | 1.0 | 2.0% | |||
| 96 | Nokia Corporation Sponsored NOK | 18.7B | $3.3 | 0.91% | $3.4 | $3.4 | $3.3 | $3.3 | 35,251,679 | 0.1 | 0.1 | 3.9% | |||
| 97 | NAVER 035420.KS | 0.0195T | $129.4 | 0.06% | $130.2 | $130.8 | $129.4 | $129.3 | 405,813 | 0.0 | 0.0 | 0.0% |
Also, Check –
What is a Tech Company?
Tech companies research, design, manufacture, and distribute products and services to solve technical problems. They are also known as IT (information technology) or high-tech companies that implement mobile phones, computers, electronic devices, software, and many technologies to improve life.
These companies are not just providing the things people need but also preserving our environment by making it more sustainable and safe.
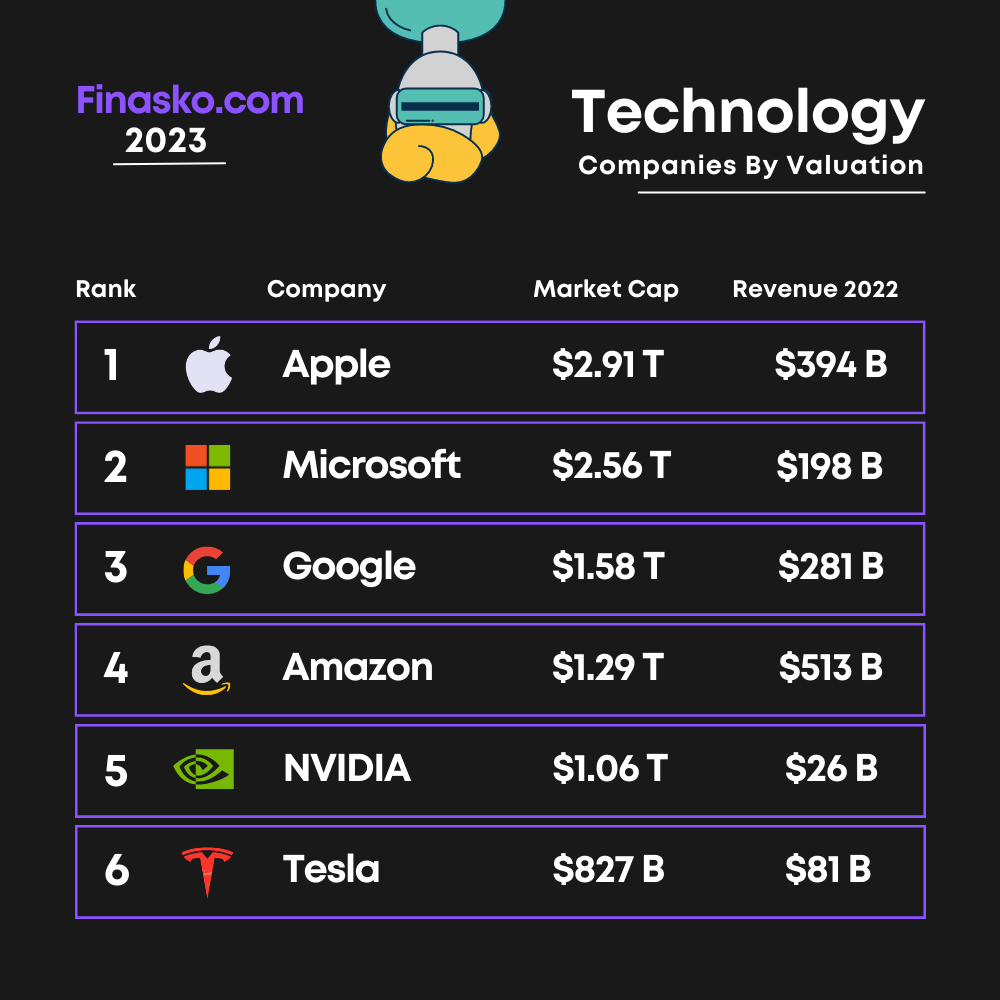
Apple is the Biggest Tec company in the World by Market Cap.
These are World’s top 5 tech companies-
1. Apple
2. Alphabet (Google)
3. Amazon
4. Facebook (Meta)
5. Microsoft
Google, Microsoft, and LinkedIn are the best companies to work for, also you can check out our post on Best Companies to Work for.
0 Comments