P/E Ratio For Stock Investing

Do you believe that a low Price Earnings Ratio always indicate undervalued stocks?
If the answer is Yes, then think again...
In this post, I'm going to show you the most practical guide to the P/E Ratio ever.
By the end of this guide, you'll be a pro at using the PE Ratio to identify the next super stock for your portfolio.
So get ready to take your financial knowledge to the next level.
Basics of P/E Ratio
The price-to-earnings (P/E) ratio is a measure of how much the market values a company's stock compared to its earnings, or how much the investors are willing to pay for each dollar of the company's earnings.
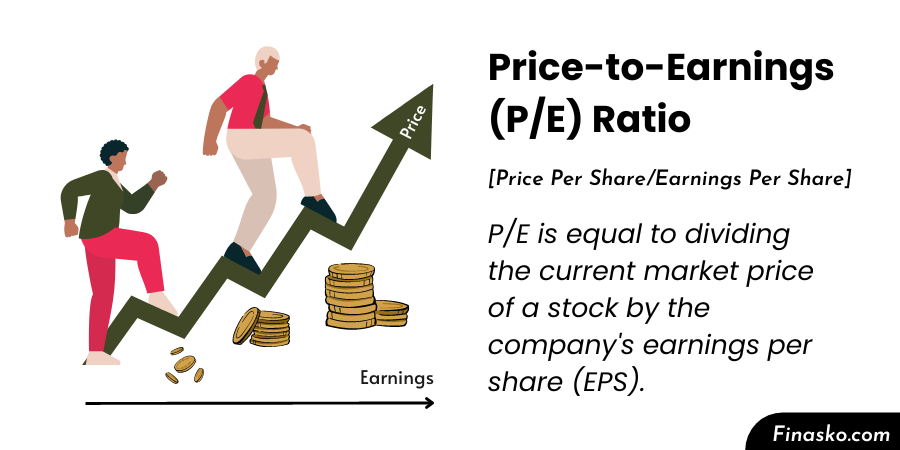
➤ P/E Formula
[PE Ratio = Price Per Share/Earning Per Share]
[PE Ratio = Dividing the current market price of a stock by the company's earnings per share (EPS)]
➤ For example
If a company's stock is currently trading at $100 per share and its EPS is $5, then the P/E ratio is 100/5, or 20. This means that investors are willing to pay $20 for every $1 of the company's earnings.
Often novice traders buy falling stocks having a Low P/E ratio because they are taught a simple rule “Low P/E means Stock is Undervalued”. In most cases, these stocks continue to fall and investors face heavy losses due to this “Bargain Trap”.
That's why it's important for investors & traders to understand the practical applications of the P/E ratio in order to avoid significant losses in their portfolios."
Check: S&P 500 PE Ratio
Understanding PE Ratio with Example
Price to Earning Ratio is the most widely used financial metric to asses a stock but the majority of traders are using it in the wrong way.
Let’s understand PE with an example of the World’s Biggest Car Companies.
PE Ratios (as of 26 December 2022)
- Tesla PE = 38.05
- Toyota PE = 9.26
➤ In Simple Words:
For Every $1 of Tesla’s Earning, Investors are ready to pay $38.05
For Every $1 of Toyota’s Earning, Investors are ready to pay $9.26
Both companies are from the same industry then why investors are willing to pay high to Tesla? Is Tesla overvalued?
An amateur value investor will jump to buy Shares of Toyota thinking that the stock is very undervalued and cheap compared to Tesla.
But it’s just a half-truth. Let’s understand the complete picture
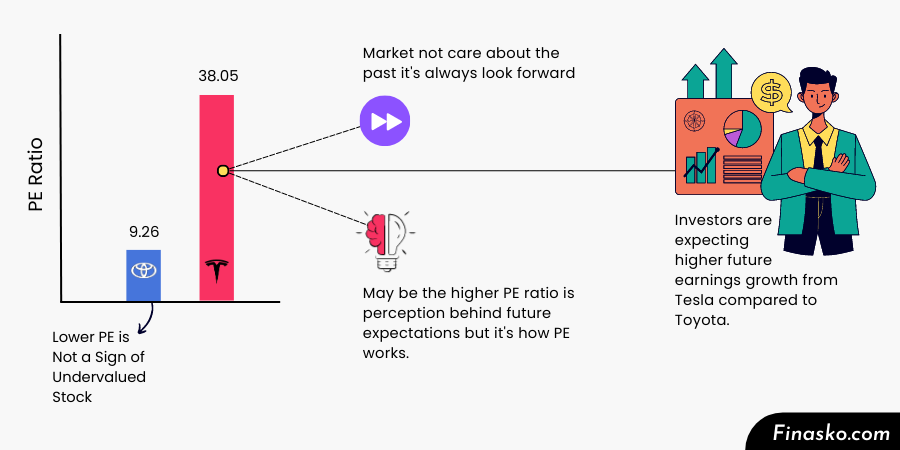
There is a reason why one stock is trading at a high PE multiple and another at low PE multiple.
“Stock Market is a Forward Looking System or a Discounting Mechanism. It cares little about past and prices in future events/future outcomes.”
Generally, High PE means Investors are expecting that company’s future earnings will grow at a higher rate and a Low PE means Investors earnings expectations are relatively low.
On the basis of historical earnings, you can say that Tesla is overvalued compared to Toyota but the Market is interested in Futures Earnings Growth.
Tesla’s High PE is linked to the Investor’s perception of Tesla’s ability to expand earnings at a high rate.
In other words, you can say that the Price Earnings ratio measures the Level of Expectations or the Investor’s Perception of the future growth of the company.
Trailing Vs Forward PE (How to Calculate)
Trailing PE Ratio

Trailing or TTM PE (trailing twelve months price-to-earnings ratio) is calculated based on the historical earnings of the company.
➤ TTM PE Formula = Market Price per Share / EPS (last 12 months)
Typically Trailing PE Ratio is referred to by the majority of market participants but it's relatively less important because it's based on historical earnings. The market is more interested in what's coming in the future so forward PE is relatively better.
Forward PE Ratio

The forward PE Ratio is based on the future projected earnings of the company. Market Analysts estimate the future earnings of the company by considering the company’s future guidance and other factors.
➤ Forward PE Formula = Market Price per Share / Projected EPS for the next 12 months
The limitation of forward PE is that ultimately its based on future earning predictions and the opinions of different analysts. So You can expect it to accurately represent the future earnings of the company.
PEG Ratio

PEG means Price-Earning to Growth Ratio, which compares a company's P/E Ratio to its expected earnings growth rate.
➤ PEG Formula = PEG ratio = PE Ratio/projected earnings growth rate
It's tell us => How Much Investors are Willing to Pay for Every 1% of Earning Growth
➤ For Example If a company has a P/E ratio of 20 and an expected earnings growth rate of 10%, its PEG ratio would be 2. In other words, Investors are willing to pay $2 for every 1% of earning growth.
The PEG ratio gives a relatively better picture of a company’s valuations as it considers growth rate.
What is a Good PE Ratio? Is High PE Good or Bad?

You may have heard something like “Stocks with Low PE are attractive Investments”
Historically, the average PE of benchmark indices like S&P 500 comes around so there is a general perception that a PE Ratio of 20 or below is good.
But the reality is that “there is no magic number of PE” or any objective rule for determining whether a company with a low price-to-earnings (PE) ratio is a good investment or not
In fact, In growth stocks, you will find out that the majority of Super performer Stocks had relatively high PE before their biggest advances. Look at the below chart of Tesla:
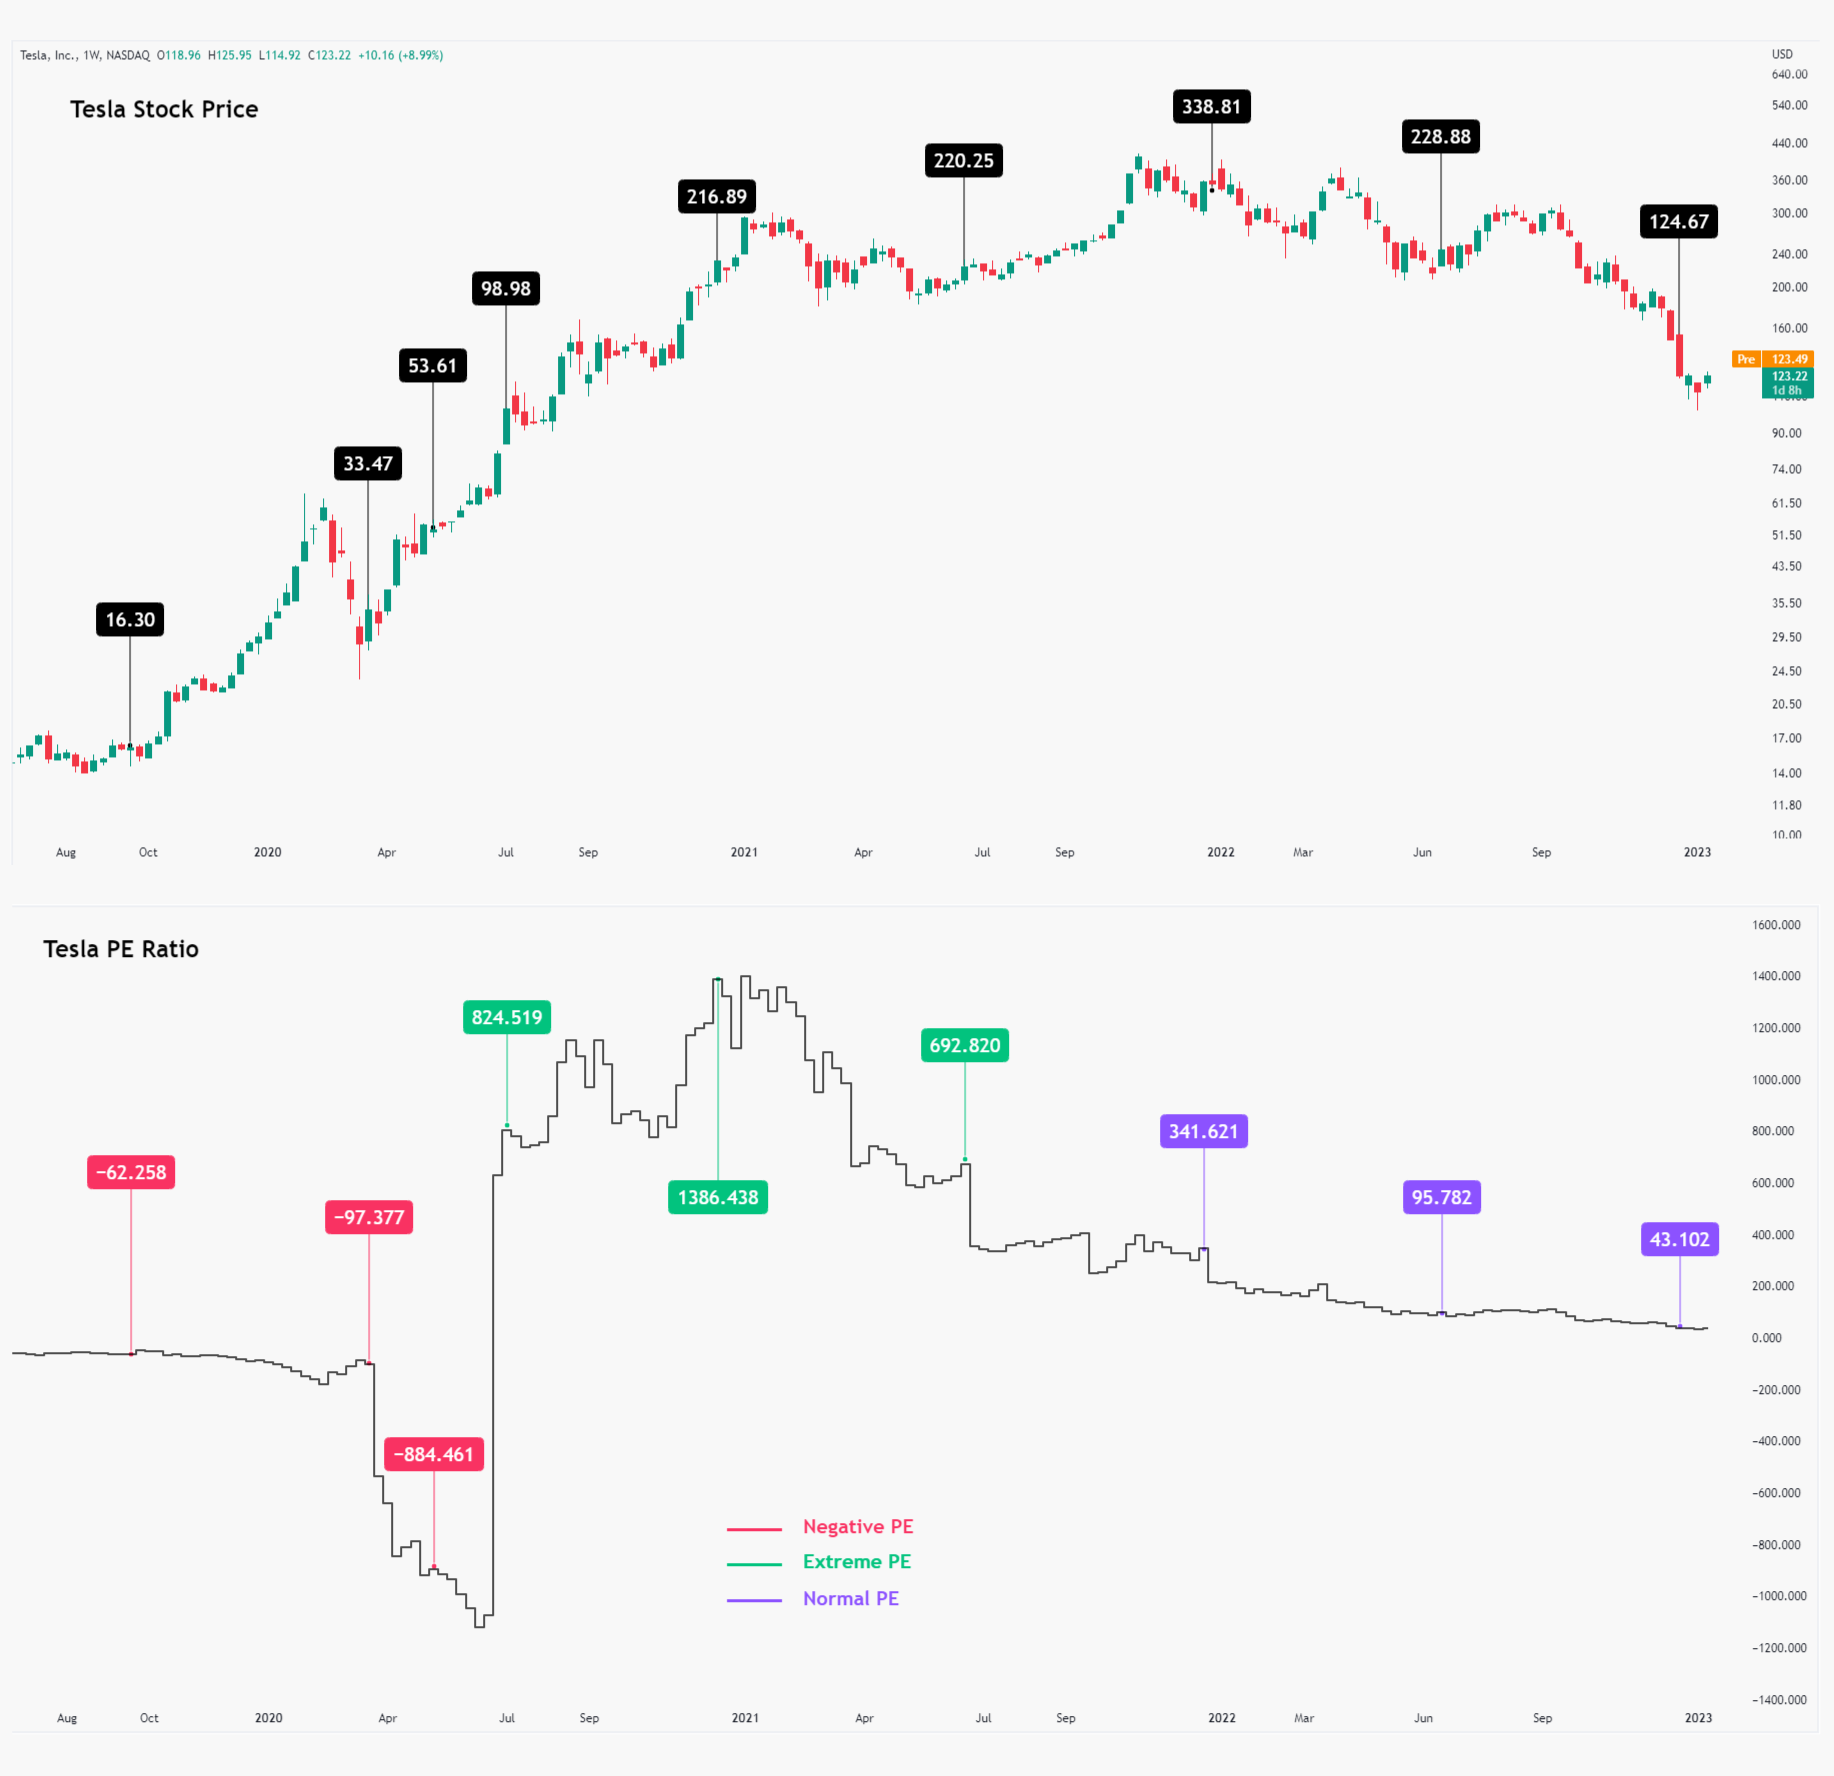
Tesla’s Stock Given Huge Returns When PE Ratio was high and it started falling badly when PE comes down.
The majority of value investors may have missed Investing in Tesla by looking at its High PE because of their misunderstood theory that “High PE Stocks are Expensive and Overvalued”
“In Stock Market, there is no Holy Grail or Magic Formula. Everything is Dynamic, Subjective, and Relative ”
Value Trap

A stock is down 40% from its recent highs. It has a PE Ratio of 5X against the Industry’s average of 20X.
What comes to your mind?
An amateur investor will think like
“I should jump to buy this stock as I am getting a 40% discount”
If you also have similar thoughts then I want to tell you that this approach will lead to the biggest blunder in your investing journey.
Here is an example of Meta(Facebook) which fell 77% From Top:
- September 2021: Stock of Meta Platforms made a high of $385 when It has a PE Ratio of 28.
- March 2022: Thereafter stock started to fall and it was almost down 50% from its top when it has PE ratio of 14.
If you solely invest based on PE Ratio, you might have invested in $META after 50% price drop as EPS was flat but price fell almost 50%. As a value investor, you might think that a $META is undervalued Stock at a PE of 14 as it was usually trading at PE of 28.
Imagine What would be the result, a loss of 40-50% even after you invested at a discount of 50%
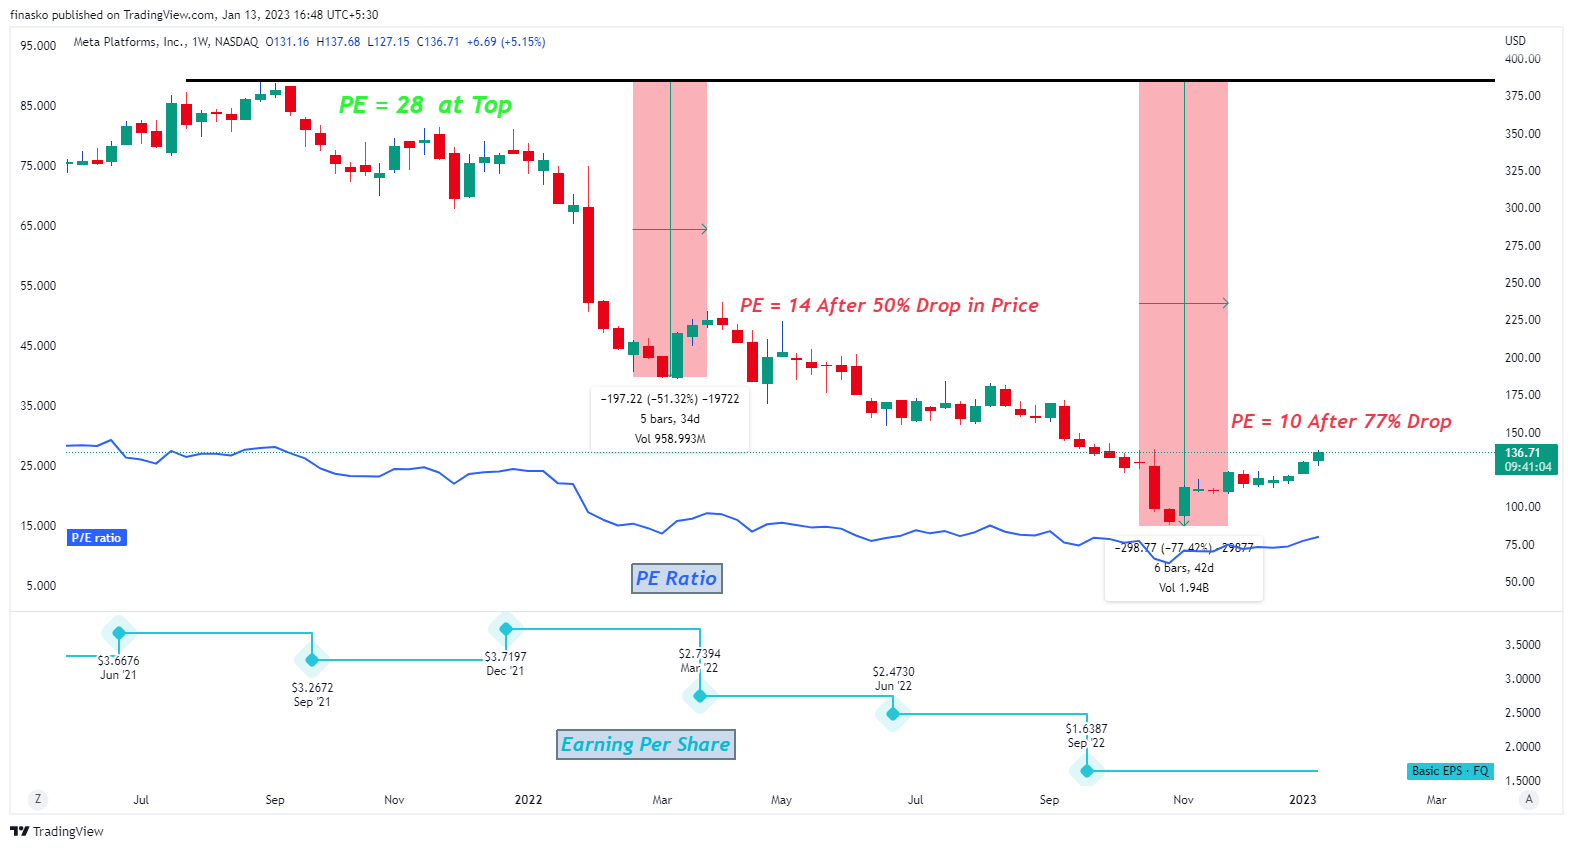
There is a reason why a stock is falling and what looks cheap may be the most expensive one.
Often stock prices are a reflection of a company’s future performance in advance.
Stock Price => Forward Looking => Leading Indicator
Earnings => Historical Data => Lagging Indicator
Conclusion

In conclusion, here some insights about P/E Ratio that will help you in your Investing journey:
- PE Ratio is highly misunderstood and overused metric. It just simply tells you how a stock is priced compared to its earnings [Share Price/EPS]
- It shows investor's perception about Company's future earning growth. Its normal for high growth stocks to trade at premium compared to the market or sector.
- In starting phase, many potential super-performance stocks has an unreasonably high P/E Ratio before their biggest rally. A high PE does not always mean that the Stock is Overvalued.
- Stock Market is a forward looking instrument and discounting mechanism. Market participants tries to anticipate future performance of the company and it reflects it in Stock Prices.
- In Stock Market, everything has to be seen in context. Sometimes a Company with PE of 100 are better than a company trading at PE of 5.
- Forward PE and PEG ratio are relatively better metrics than a Historical P/E (TTM PE).
- PE Ratio is not a magic formula and its just an another metric. To achieve high ROI, investor needs to follow a holistic approach and more focus should be on future outlook.

Abheey
Abheey is a financial market enthusiast with 5 years of experience in Trading Stocks. He is an expert in simplifying financial concepts with data visualizations that helps people to create wealth.
