What is 3D Printing?
3D printing is a manufacturing technology used to simplify the physical process of producing a three-dimensional object by building it up layer by layer. It’s a technology that will eventually change everything as we know it right now. According to Statista, the 3D Printing market size was around 12.6 billion U.S. dollars in 2020, and it’s growing with 17% CAGR between 2020 and 2023.
The overall process consists of several steps of creating the three-dimensional object, starting with a digital model, slices, converting into code, and then processing them. 3D printers have been in the industry for many years, and they have gone through changes over time, but now they are more efficient and reliable than ever before.
PRNT ETF Holding List (All 60)
In this guide, we’ll be looking at an ETF called the PRNT which invests in 3D printing companies. This is an overview of it’s stock price, weight and market cap as well as a couple of catalysts in the 3D space that may give investors a head start on the next big investment.
(Last Update: 01 Feb 2022)
Symbol | Company | Weight (%) | Price | Market Cap |
---|---|---|---|---|
DREYFUS GOVT CASH MAN INS | 4.11% | |||
MSFT | MICROSOFT CORP | 3.59% | $258.4 | $1,923,105,816,576.0 |
ALTR | ALTAIR ENGINEERING INC - A | 3.51% | $57.8 | $4,629,826,560.0 |
PTC | PTC INC | 3.44% | $130.6 | $15,425,005,568.0 |
ADSK | AUTODESK INC | 3.43% | $223.7 | $48,258,449,408.0 |
ANSS | ANSYS INC | 3.40% | $275.2 | $23,975,890,944.0 |
TRMB | TRIMBLE INC | 3.40% | $60.3 | $14,871,486,464.0 |
FARO | FARO TECHNOLOGIES INC | 3.19% | $29.0 | $544,801,984.0 |
DM | DESKTOP METAL INC-A | 3.14% | $2.1 | $676,439,040.0 |
VLD | VELO3D INC | 3.13% | $3.0 | $549,936,064.0 |
DSY.F | DASSAULT SYSTEMES SE | 3.13% | € 38 | € 50,191,745,024 |
AM3D.F | SLM SOLUTIONS GROUP AG | 3.12% | € 18 | € 447,257,184 |
ACAH | ATLANTIC COASTAL ACQUISITI-A | 2.94% | $10.1 | $435,346,880.0 |
HPQ | HP INC | 2.93% | $30.5 | $29,965,275,136.0 |
MTLS | MATERIALISE NV-ADR | 2.92% | $11.1 | $655,604,864.0 |
NNDM | NANO DIMENSION LTD - ADR | 2.92% | $2.8 | $723,330,496.0 |
SSYS | STRATASYS LTD | 2.84% | $14.8 | $988,403,200.0 |
RSW.L | RENISHAW PLC | 2.80% | $4,036 | $2,992,371,200 |
PRLB | PROTO LABS INC | 2.79% | $33.1 | $896,755,904.0 |
FATH | FATHOM DIGITAL MANUFACTURING | 2.71% | $1.3 | $181,815,232.0 |
STMN.SW | STRAUMANN HOLDING AG-REG | 2.71% | $133 | $21,108,404,224 |
XMTR | XOMETRY INC-A | 2.67% | $38.6 | $1,830,239,104.0 |
DDD | 3D SYSTEMS CORP | 2.64% | $12.0 | $1,576,567,296.0 |
MKFG | MARKFORGED HOLDING CORP | 2.60% | $1.5 | $281,498,656.0 |
CFMS | CONFORMIS INC | 2.53% | $2.6 | $19,693,910.0 |
BICO.ST | BICO GROUP AB | 2.28% | $119 | $8,188,829,184 |
AME | AMETEK INC | 1.72% | $146.4 | $33,616,752,640.0 |
HEXA-B.ST | HEXAGON AB-B SHS | 1.66% | $125 | $329,341,239,296 |
ALGN | ALIGN TECHNOLOGY INC | 1.65% | $343.1 | $26,800,365,568.0 |
UPS | UNITED PARCEL SERVICE-CL B | 1.22% | $191.7 | $170,566,287,360.0 |
XTC.TO | EXCO TECHNOLOGIES LTD | 1.21% | $7 | $288,730,752 |
LECO | LINCOLN ELECTRIC HOLDINGS | 1.21% | $174.5 | $10,075,351,040.0 |
ARNC | ARCONIC CORP | 1.20% | $24.9 | $2,539,222,784.0 |
ML | MICHELIN (CGDE) | 1.20% | $0.8908 | $248,719,376.0 |
KALU | KAISER ALUMINUM CORP | 1.19% | $93.9 | $1,497,141,120.0 |
OERL.SW | OC OERLIKON CORP AG-REG | 1.18% | $6 | $2,088,856,448 |
MOG-A | MOOG INC-CLASS A | 1.18% | $93.5 | $3,137,406,208.0 |
GE | GENERAL ELECTRIC CO | 1.17% | $82.0 | $89,555,230,720.0 |
SIE.DE | SIEMENS AG-REG | 1.17% | € 145 | € 114,935,021,568 |
AJRD | AEROJET ROCKETDYNE HOLDINGS | 1.09% | $55.9 | $4,504,291,328.0 |
SHPW | SHAPEWAYS HOLDINGS INC | 0.74% | $0.7299 | $35,981,004.0 |
MSVT.TA | MASSIVIT 3D PRINTING TECHNOL | 0.37% | $778 | $170,478,464 |
3402.T | TORAY INDUSTRIES INC | 0.12% | $779 | $1,246,640,734,208 |
EVK | EVONIK INDUSTRIES AG | 0.12% | $0.0000 | $0.0000 |
VNP.TO | 5N PLUS INC | 0.11% | $3 | $280,006,752 |
SAND | SANDVIK AB | 0.11% | $5.5 | $1,629,340,544.0 |
DD | DUPONT DE NEMOURS INC | 0.11% | $73.0 | $36,255,662,080.0 |
AKE.PA | ARKEMA | 0.11% | € 98 | € 7,298,638,848 |
DSM | KONINKLIJKE DSM NV | 0.11% | $6.1 | $299,537,920.0 |
XRX | XEROX HOLDINGS CORP | 0.11% | $17.0 | $2,642,045,440.0 |
MMM | 3M CO | 0.11% | $117.5 | $64,530,792,448.0 |
HEN3.F | HENKEL AG & CO KGAA VOR-PREF | 0.11% | € 65 | € 27,451,817,984 |
HXL | HEXCEL CORP | 0.11% | $69.8 | $5,873,792,000.0 |
EMN | EASTMAN CHEMICAL CO | 0.11% | $90.2 | $10,715,759,616.0 |
CRS | CARPENTER TECHNOLOGY | 0.11% | $51.0 | $2,471,543,808.0 |
ATI | ALLEGHENY TECHNOLOGIES INC | 0.11% | $40.1 | $5,189,661,696.0 |
KODK | EASTMAN KODAK CO | 0.10% | $4.0 | $318,780,256.0 |
SGLFF | SGL CARBON SE | 0.10% | $8.0 | $1,052,024,000.0 |
VOE | VOESTALPINE AG | 0.10% | $145.7 | $0.0000 |
PYR | PYROGENESIS CANADA INC | 0.10% | $1.0 | $181,710,240.0 |
(Download The Latest List Below – Updated Daily)
Overview of PRNT ETF
Stock | Price | Change | Change % | Volume | 52 Week Range |
---|---|---|---|---|---|
3D Printing (The) ETF PRNT | $24.5 | $0.46 | 1.84% | 17,558 |
PRNT Performance
Annualized Returns (31 Dec 2021)
PRNT ETF | NAV | Market Price |
1 Year | 9.66% | 9.00% |
3 Years | 19.98% | 19.59% |
5 Years | 10.98% | 10.87% |
Max | 11.10% | 11.01% |
Calendar Year Returns –
PRNT ETF | NAV | Market Price |
2021 | 9.66% | 9.00% |
2020 | 39.52% | 40.18% |
2019 | 12.91% | 13.06% |
2018 | -17.22% | -17.80% |
2017 | 17.76% | 18.02% |
Important Note: Market returns are based on the trade price at which shares are bought and sold on the Cboe BZX Exchange, Inc. using the last share trade. Market performance does not represent the returns you would receive if you traded shares at other times.
Total Return reflects the reinvestment of distributions on ex-date for NAV returns and payment date for Market Price returns. The market price of the ETF’s shares may differ significantly from their NAV during periods of market volatility.
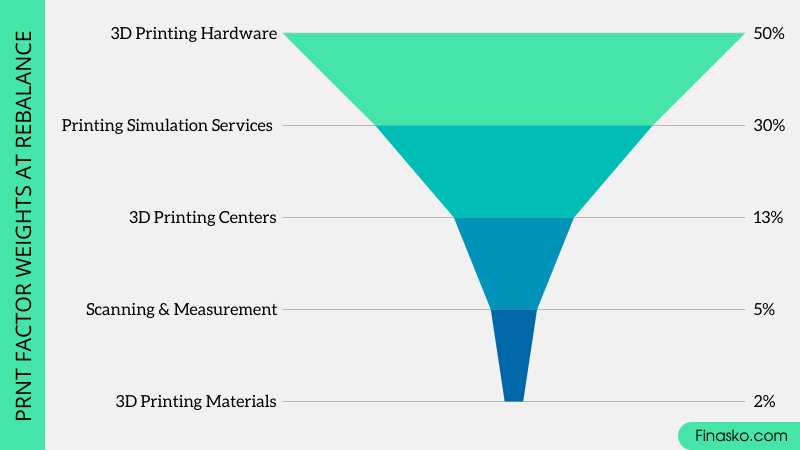
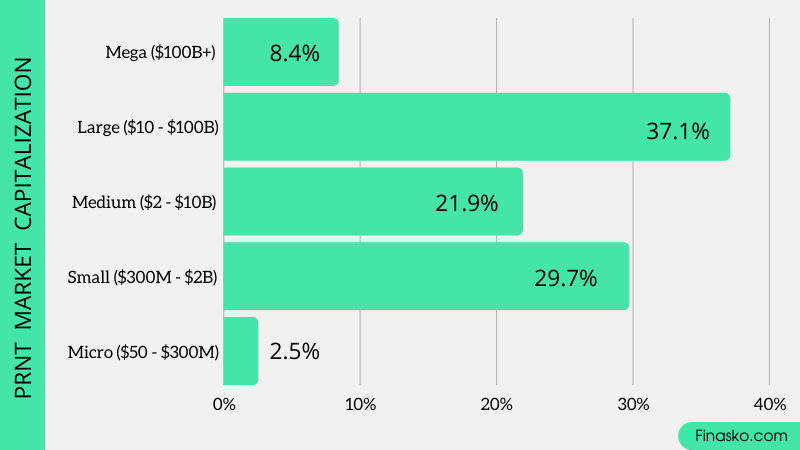
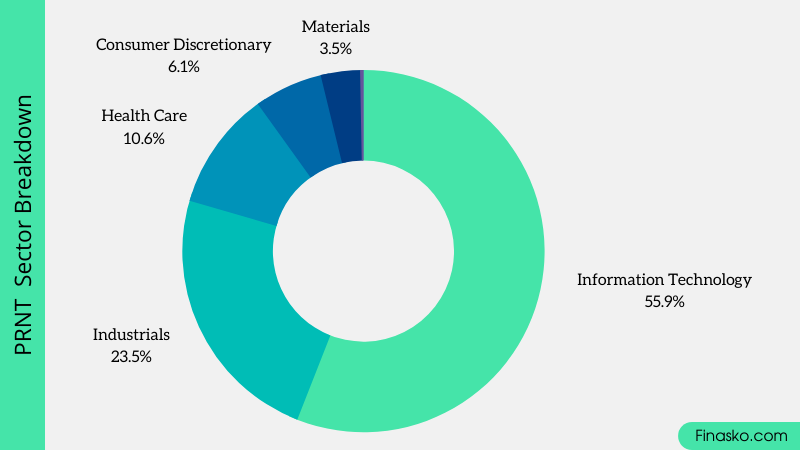
Exposure Breakdowns
Here are the few charts that explain where is PRNT ETF Holding…
1 INDEX FACTOR WEIGHTS AT REBALANCE
2 MARKET CAPITALIZATION
3 SECTOR BREAKDOWN
Should You Invest In PRNT?
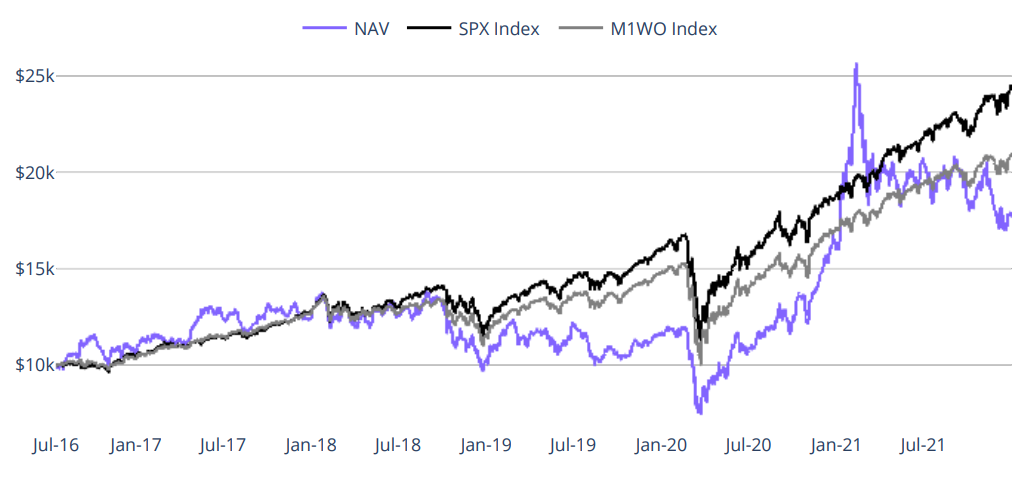
If you invest $10,000 in this PRNT ETF fund, the returns would be something like this –
Frequently Asked Questions
The expense ratio of The 3D Printing (PRNT) ETF is 0.66%
If you come blindly, there is risk in the entire stock market. Taking about PRNT, It’s like a mutual fund, which is managed by a team of experts and ensures that you get a better return on your investment. It also keeps looking for new opportunities, so sometimes an investor’s portfolio goes down due to market volatility. But long story short no doubt ETFs are a good investment in the long run.
Desclaimer ✋
The information included at this site is for educational purposes only and is not intended to be a substitute for investment advice. Data on past performance, where given, is not necessarily a guide to future performance. So before investing you should carefully consider the Fund’s investment objectives, risks, charges, and expenses.
What to do Next?
Thank you for reading, I hope this post is helpful for you. Please share it with your friends and also tell me in the comments which investment fund you’re likely to invest in 🙂
More Details About PRNT – Check the Official ARK ETF Website
0 Comments