The Volume Weighted Average Price (VWAP) Indicator provides the true intraday average price of any stock or security based on its price and volume traded throughout the day.
It’s a popular indicator among days traders who want to track the overall direction of a stock’s price movement and identify potential buying or selling opportunities. Even when institutional investors want to buy large positions, they try to place their orders near or below the VWAP level.
So, If you want to take your trading to the next level, this post is a must-read. I’ll break down the VWAP Indicator and show you how it can help you become a better and more profitable trader, whether you’re a seasoned pro or just starting out. Don’t miss out on valuable insights.
Let’s Get Started…
- What is VWAP
- VWAP Calculation & Examples
- What is Anchored VWAP
- How to Set Up VWAP Indicator
- How to Use VWAP in Trading & Investing
- VWAP Day Trading Strategies
What Is VWAP?
The VWAP or Volume Weighted Average Price is similar to a moving average, but it takes into account not only the price but also the relevant volume traded during the day, which makes this indicator a more accurate representation of the market’s true average price.
VWAP is calculated in a day timeframe and it represents the average price of the stock at any point in a day since the start of the day.
When the market opens, the stock or security starts trading, and order of different quantities or volumes is executed at different price levels.
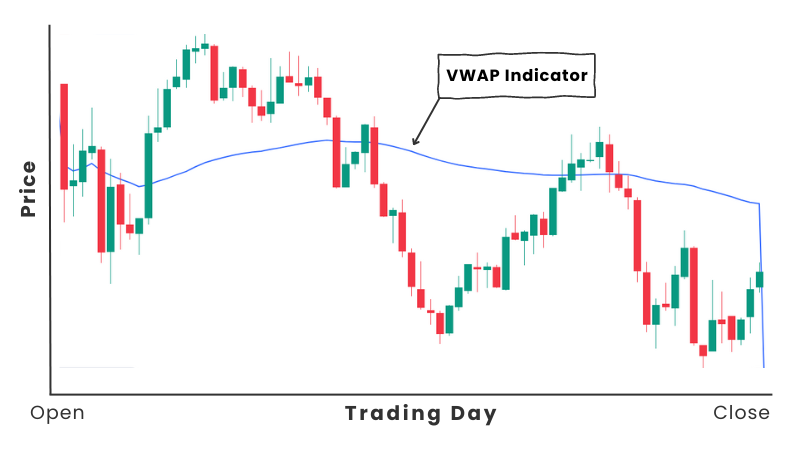
The intraday candlestick chart displays the price action in form of candles over a specified time interval, such as 5 or 15 minutes. On the price chart, VWAP is displayed as a single running line. The VWAP value is constantly calculated every minute and updated in real-time on the price chart.
VWAP Calculation & Example
You don’t have to worry about the calculation, it is automatically calculated and displayed on your trading platforms like Tradingview, MT4, or Thinkeorswim.
To calculate VWAP, the total value of transactions (Price*Volume) is divided by the total volume since the market opened.
VWAP Formula:

- VWAP = Volume Weighted Average Price
- Σn1 = Total/Sum of
- Price = Average of Candle High+Low+Close
- Volume = Volume Per Price Candle
Note: Often Typical Price [High price + Low price + Closing Price/3] of 1-minute data is used for calculation purposes.
Understand the calculation with an example:
Let’s say a stock is traded as follows during a day:
Time: 11:30, Price: $10, Volume: 1000
12:00, Price: $11, Volume: 2000
01:00, Price: $12, Volume: 1500
02:00, Price: $13, Volume: 2500
Now if we have to calculate VWAP at 11:00 am, the calculation will be as follows:
$10 * 1000 = $10,000
$11 * 2000 = $22,000
$12 * 1500 = $18,000
Sum of (Price * Volume) = $50,000
Total Volume = 1000 + 2000 + 1500 = 4,500
VWAP = $50,000 / 4,500 = $11.1111
Therefore, the VWAP at 11:00 am is $11.1111.
Similar to the above calculation, charting software automatically calculates VWAP after every minute and represents it on a chart as a single moving line.
Anchored VWAP (AVWAP)
Anchored Volume Weighted Average Price (AVWAP) is a more flexible alternative to the traditional Volume Weighted Average Price (VWAP).
While the traditional VWAP starts from the day’s opening session and calculates the average price for the entire day, AVWAP allows you to set the starting point for the calculation at any point, such as the swing high or low.
You can use the AVWAP as support and resistance areas by adjusting its placement.
For Example 1
If you want to calculate the Volume Weighted Average Price from the day high, you can set the Anchored VWAP Indicator from high.
Based on the image above, it is apparent that the AVWAP is indicating a resistance area, suggesting a high probability that the price will experience a reversal from that level.
For Example 2
Also setting AVWAP from a low point will show you the support areas…
How to Set Up VWAP Indicator
You can set up VWAP in your trading platform like Tradingview or ThinkorSwim through the “Indicator Section”
- Open Tradingview and go to Charts.
- Click on any Stock or Security.
- Navigate to the Indicator Section.
- Enter “VWAP” and choose the first one.
- Now go to the VWAP setting.
- Revome everything except the VWAP line.
- The VWAP line is now ready for use.
Timeframe: VWAP is a day trading indicator and it works best in the intraday timeframe like 5 minutes or 15 minutes.
How to Use VWAP in Trading & Investment
#1 Trading: Understanding Market Structure with VWAP
Demand and supply forces in the market drive the movement of stock prices.
VWAP is a powerful tool that gives traders a clear picture of what’s happening in the market.
By reading VWAP and Price Action, traders can get a sense of who is in control of the market, either buyers or sellers.
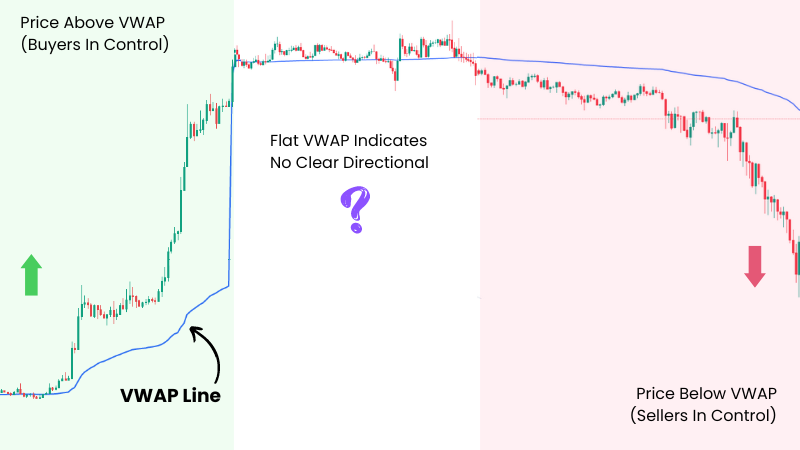
- A rising VWAP generally indicates that the buyers are in control and that the trend is up.
- A falling VWAP suggests that the sellers are in control and that the trend is down.
- A flat VWAP indicates that the market is in a period of consolidation and that there is no clear directional bias.
#2 Investment: VWAP As a Benchmark Price
Institutional investors like Mutual funds or Pension funds usually buy large quantities of stocks. Their huge buy orders can push the prices significantly higher making it difficult to execute orders at the best prices.
Usually, the VWAP zone has relatively high liquidity. By entering or exiting positions near the VWAP, institutional investors can get the best price without disrupting the market price.
For large investment firms, the VWAP serves as a key benchmark for the quality and efficiency of their trade execution.
Best VWAP Trading Strategies For Day Traders
Use VWAP Indicator as a Support and Resistance, it’s a true average price of the day, representing the equilibrium level of trading activity.
If the market price is above the VWAP line, buyers profit while short sellers lose.
Conversely, below the VWAP, buyers lose while sellers profit. Traders often make decisions near the VWAP zone, which is the average price of executed trades.
Since it is a critical reference point, the VWAP functions as a strong support or resistance zone for most traders in the intraday timeframe.
#1 Continuous Trend: VWAP Pullback
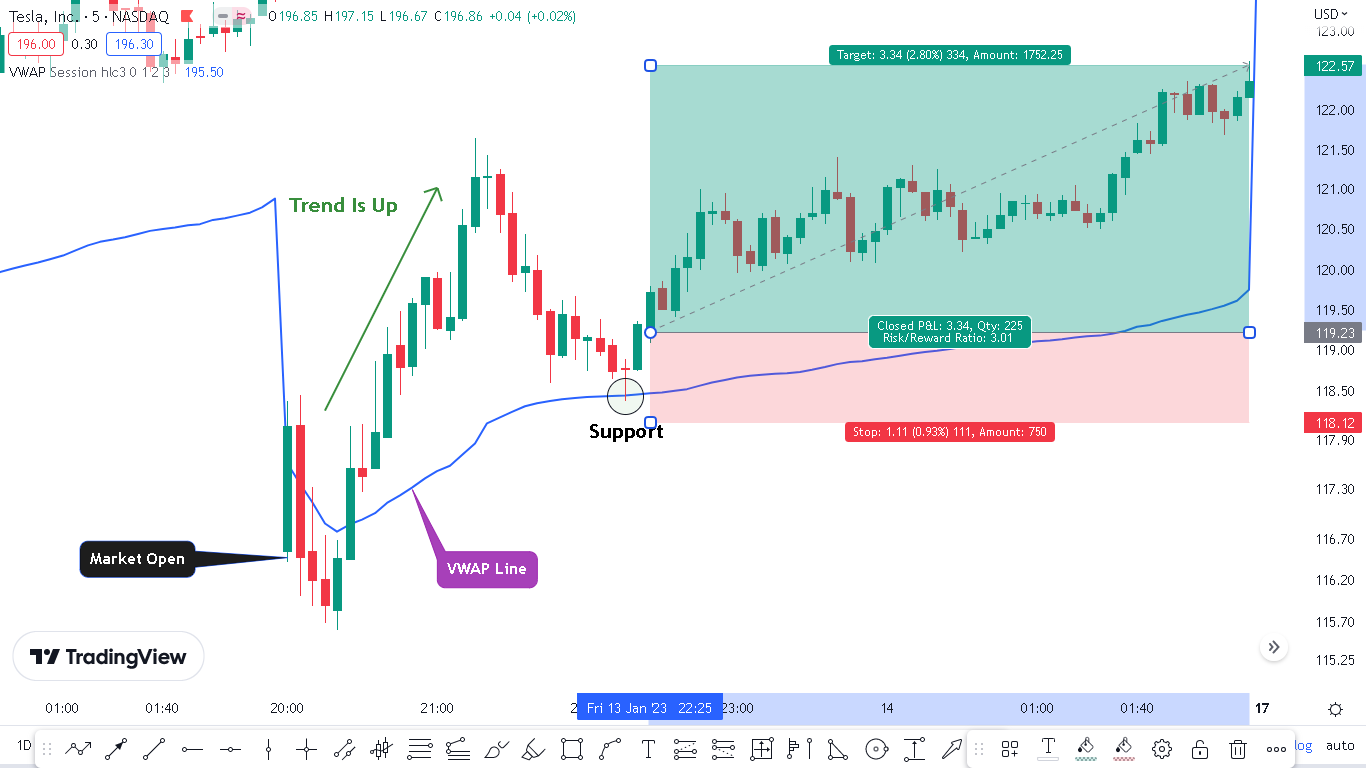
If the trend is up and VWAP is rising, you can enter a long trade when the price comes and takes support near VWAP. The stop loss can be below VWAP
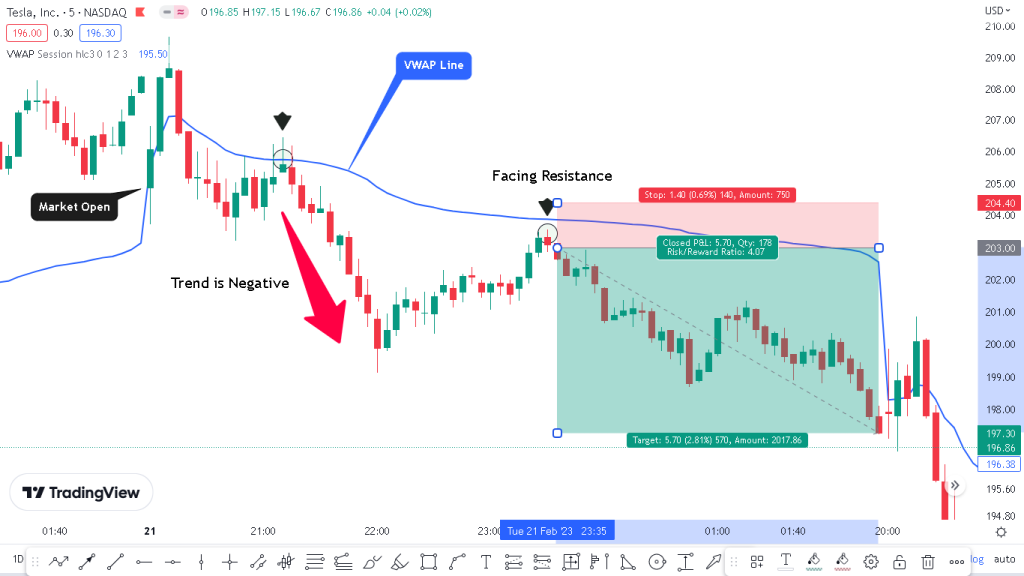
If Trend is down and VWAP is falling, you can enter a short trade if prices come near VWAP and face resistance. Stop Loss above VWAP
#2 Reversal of Trend: VWAP Breakout
When security is trending in a consistent direction and its price suddenly breaks the VWAP, it could signal a possible reversal of the trend. Traders can look for this by monitoring for changes in the price, such as a break in a significant support or resistance level.

Traders should confirm a reversal before trading by checking other technical indicators such as moving averages or trend lines that also indicate a change in trend. By doing so, traders can make more informed decisions about entering or exiting a position.
#3 Range Breakout
In a VWAP Range Breakout strategy, we identify the price range with a flat VWAP Line that has been trading for a period of time.
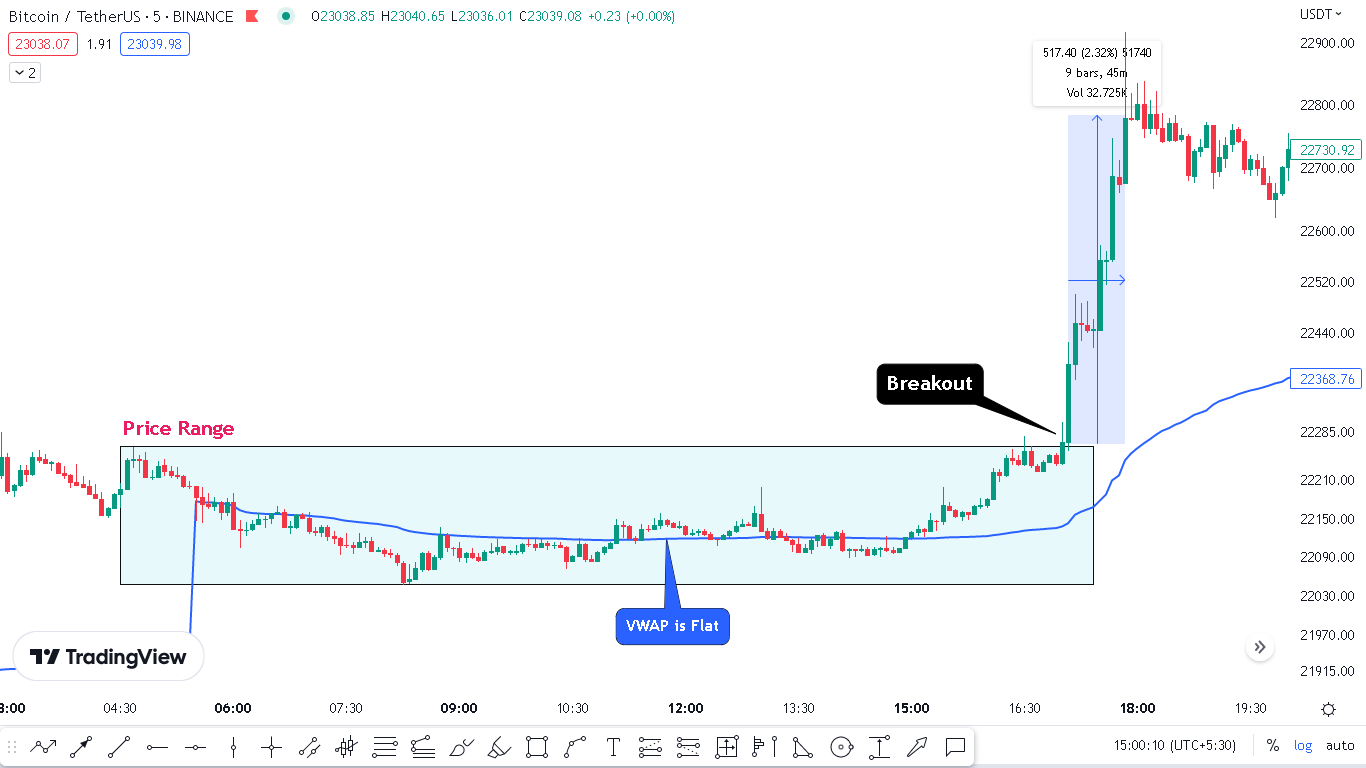
To make a trade – the trader looks for the price to break through the upper or lower boundary of the range with a high trading volume. Traders can use the VWAP indicator to confirm a breakout by verifying that the volume-weighted price also moves in the direction of the breakout.
0 Comments