
S&P 500 Historical Dividend Yield
The current Dividend Yield Is 1.64%
The SP 500 Dividend Yield is calculated by taking the weighted average of S&P 500 companies’ annual dividends and dividing it by the current share price. The yield shows how much money an investor who invests in the index might expect to gain from dividend payouts alone.
Because companies with a good track record pay higher dividends, this number can be used as one of the factors to determine whether a stock in the S&P 500 is attractive compared to its peers.
Historical dividend yields of the S&P 500 reveal that dividends have been a central part of stock valuations for nearly 150 years. During the 1990s, however, this trend reversed itself.
Low or negative interest rates and ongoing corporate-financial restructuring have made it difficult for companies to return money to shareholders through dividends and share buybacks. As a result, the average annual yield for the S&P 500 Index has fallen to 3.5% since 1980 and below 2% since 2010.
Also, Check –
=> S&P 500 Dividend Aristocrats [2023]
=> All Dividend Kings Stocks List [2023]
How Is Dividend Yield Calculated?
Weighted Average Dividend ÷ Current Share Price
To compute the dividend yield (income from dividends) of the S&P 500, divide the weighted average of each listed company’s recent full-year dividend by the current share price. For example, if an annual dividend paid is $30 and the stock’s current price at $480, the dividend yield is 6.25% ($30 ÷ $480).
Note:- All annual dividend yields are quoted exclusive of inflation. The effects of inflation reduce the real impact of all returns, including dividends, and can make it more difficult to grow real wealth.
Top S&P 500 High Dividend ETF
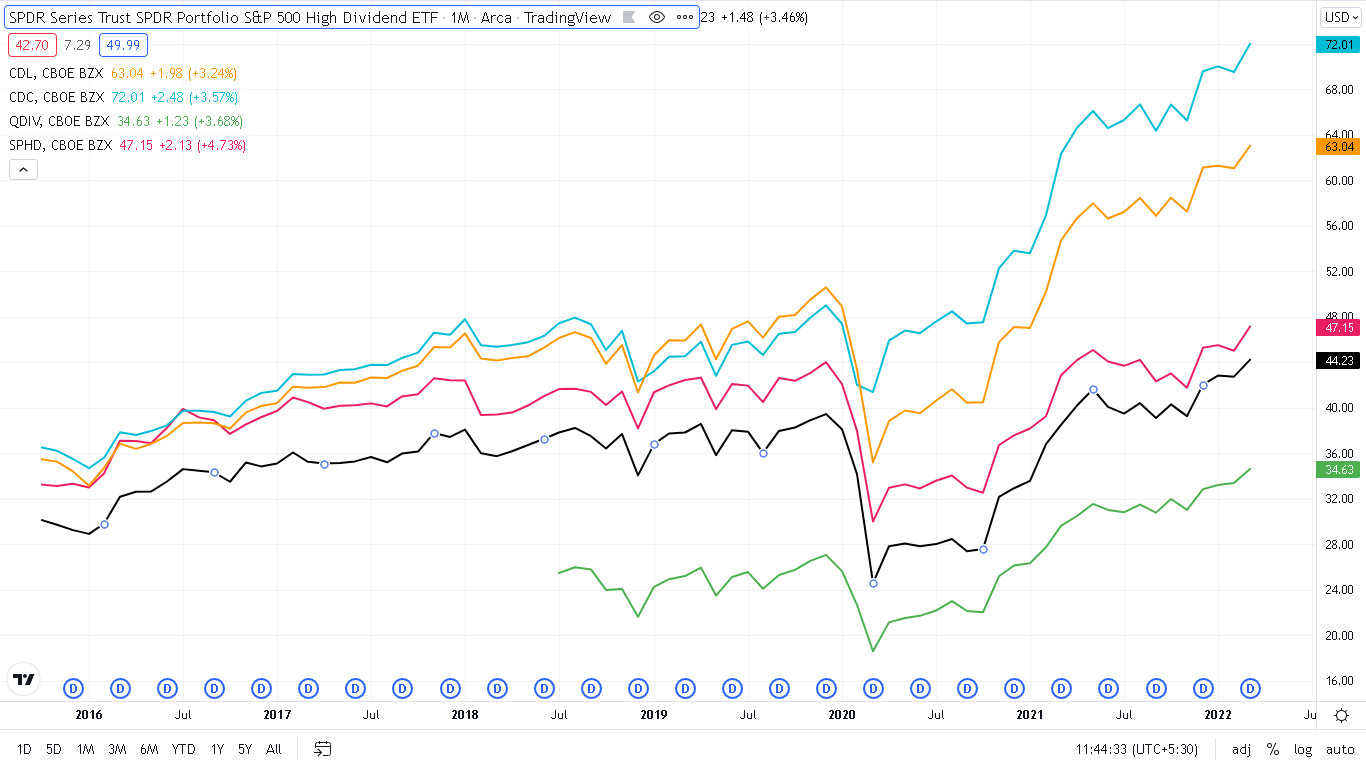
Investing in the dividend-yield market is a good way to grow your investment portfolio. However, some investors who want to invest in this kind of ETF for dividend income, so here are some of the top ETFs of 2023.
| ETF | Yield | Exp. Ratio |
| SPYD | 4.88% | 0.07% |
| SPHD | 4.89% | 0.30% |
| CDL | 2.51% | 0.35% |
| CDC | 2.51% | 0.35% |
| QDIV | 2.42% | 0.20% |
Also, See – Best ETF For S&P 500
S&P 500 Dividend Yield vs 10 Year Treasury Yield
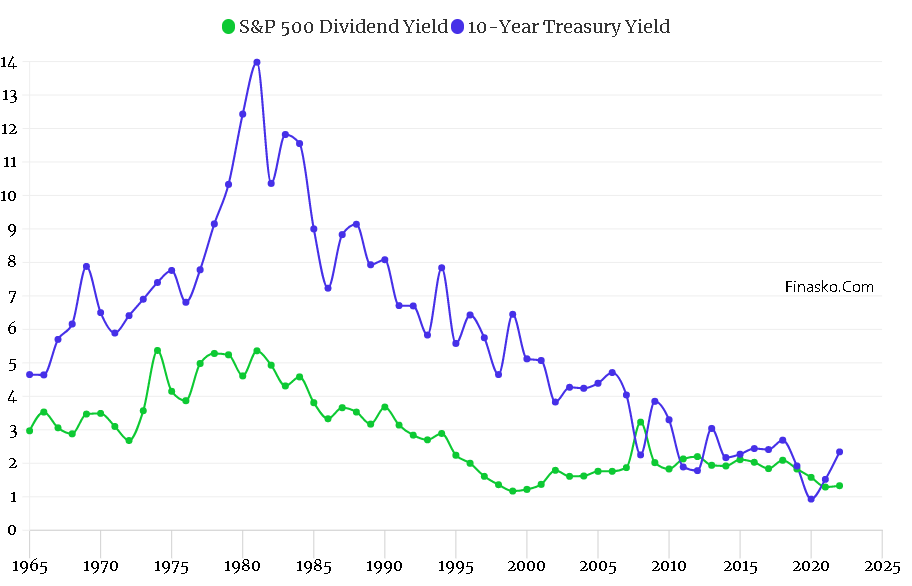
The chart above highlights that the 10-year Treasury yield is higher than the S&P 500 dividend yield. This is a highly unexpected situation because the treasury yield is regarded as a risk-free rate of return, whereas stock dividend yield is a rate of return earned on stocks and the capital appreciation that can occur.
Note:- The information contained here is provided for educational purposes only and should not be construed as individualized investment advice.
0 Comments