Artificial intelligence (AI) has infiltrated our society in the form of automation, machine learning, ...
September 24, 2023
52 Week Range 52 Weeks High 52 Weeks Low $5,264.9 $4,048.3
Being the largest index in the world and the United States, the S&P companies lead the economy as well as reflect the market behavior. The total number of stock in the index is 505 (with a different class of shares) but the surprising thing is that the top 10 companies' weight is more than 30% of the entire index.
Stock Price Marketcap Sector Open High Low Close Volume 52 Week Range $169.3 2.6T $169.9 $171.3 $169.2 $169.9 44,456,222 $406.3 3.0T $412.4 $413.0 $405.8 $399.0 29,613,265 $179.6 1.9T $177.7 $180.8 $176.1 $173.7 41,954,611 $172.0 2.1T $174.4 $174.7 $169.7 $156.0 64,533,393 $173.7 2.1T $175.9 $176.4 $171.4 $158.0 55,109,185 $168.3 536.7B $169.1 $172.1 $166.4 $170.2 108,830,097 $402.1 869.3B $403.9 $404.8 $401.4 $404.9 2,963,387 $146.1 352.2B $146.7 $147.2 $146.0 $146.8 6,134,278 $495.4 455.8B $492.0 $497.2 $491.4 $493.9 2,608,553 $877.4 2.2T $839.0 $883.3 $833.9 $826.3 54,608,830

The S&P 500 (Standard & Poor's) is the biggest index in the United States that indicates the performance of the top 500 large-cap stocks listed on NYSE or NASDAQ. S&P 500 holds $42.368 trillion market capitalization, which is more than 75% of the total total U.S. stock market capitalization comprising 11 different leading sectors. (Update: 04/01/2022)
All the 500 Companies are selected by the U.S. Index Committee based on many factors like - Market Cap, Revenue, Liquidity, Sector, Shares in the Public, Performance, Location, and Annual Trade Value, etc. For that reason, the S&P 500 is the face of the entire American market which the investor use as a benchmark so that they can compare other investment instruments at a standard level.
The Standard & Poor's 500 work on the weighted market capitalization method which means that a company with a high market cap has a high ranking in the index. The calculation of companies' weightage is very simple, taking each company's market cap and dividing it by the total market cap of the S&P 500 index.

[Note: In the S&P, Company's free float market cap is used to calculate the weight, which means only those shares are taken which are available for public trade, other shares are not included.]
Company Market Cap = Current Market Price of Stock x Company's Outstanding
Total Market Cap of Index = Add The Market Cap of Each Company in The Index
For example, Apple has a market cap of $2.998 trillion (04 Jan 2022), while the total market cap of the S&P 500 is $42.368 trillion (estimated), so the weighting of Apple stock is 7.06 in the index.
Companies with a large market cap in the index get more weightage compared to small market cap companies. As a fact, the technology sector in S&P 500 has more than 29.2% of weightage which means this industry has more influence on the index.
Also, stock weight is valuable data for investors because they can understand the importance of each stock and divide their portfolios based on stock weight to get good returns with low risk. Check this document for in-depth details about S&P Indices Methodology
The Standard & Poors index represents the top 500 large-cap stocks based on weighed market capitalization but the Dow Jones Industrial Average (DJIA) also known as the Dow 30 Stocks is focused on thirty blue chip publicly traded stocks which are price-weighted.
The value of the Dow reflecting the sum of the share price of the 30 stocks adjusted by dividend or stock split and all companies ranking changes on their importance, whereas S&P consists of stocks selected by committee only.
The S&P has all types of sector stock which is not considered in Nasdaq Index because Nasdaq-100 works on the updated market cap method which includes 100 non-financial large-cap companies which are listed on the Nasdaq Stock Exchange.
Check - How Vix Effect The S&P 500
Date | Close ($) | Milestone Events |
|---|---|---|
June 4, 1968 | 100.38 | First time above 100 |
October 19, 1987 | 224.84 | Falling 20.47% in a single day (Black Monday) |
February 2, 1998 | 1,001.27 | First close above 1,000 |
March 24, 2000 | 1,552.87 | At the peak of the dot-com bubble |
October 10, 2002 | 768.83 | Enter your text here... |
October 11, 2007 | 1,576.09 | The index achieved a new all-time intraday high |
October 13, 2008 | 1,003.35 | Best single-day 11.6% percentage gain since 1957 |
March 28, 2013 | 1,565.15 | Recovering all its losses |
August 26, 2014 | 2,000 | For the first time |
September 21, 2018 | 2,929.67 | New high record |
March 12, 2020 | 2,480.64 | Largest fall during Covid-19 (bear market) |
August 18, 2020 | 3,389.78 | End of bear market |
April 1, 2021 January 03, 2022 | 4019.79 4,796.56 | First time close above 4000 First time close above 4,790 |
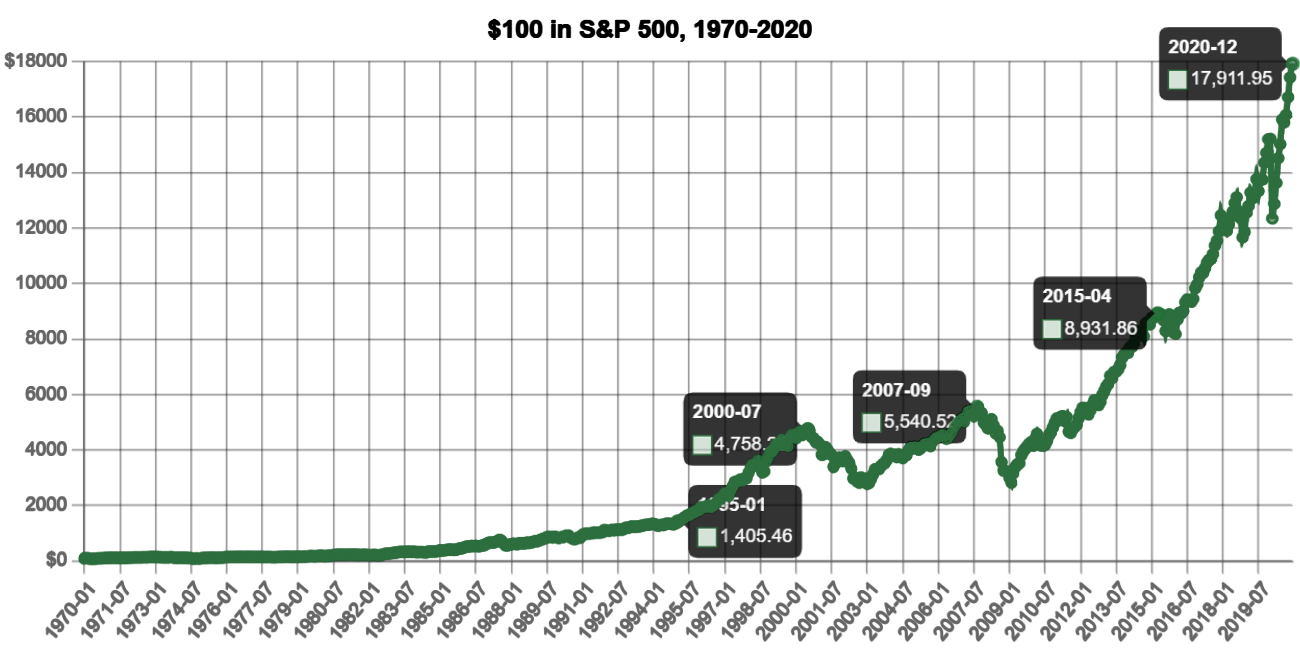
The index has generated around 10%-11% annual average returns in the last 93 years (1926-2019). So If you had invested $100 in the S&P 500 Index at the beginning of 1970, it would have grown to nearly $17,911.95 by the end of 2019 (with dividend)

Check the Dividend Stock -->

If you want to start investing, then the S&P 500 is a good option as you can focus on large-cap & blue-chip stock to get a stable return. But as we know, we can't invest directly in an index, and to invest in S&P 500, you have to buy ETFs (Exchange Traded Funds) or Index funds. Check the below post to know about the best S&P 500 ETFs or Index Funds:
You can follow below process to buy S&P 500 ETFs:
To start investing, first, you need to open a brokerage account which takes only 1-2 business days. If you don't know what is the best brokerage account for you, we recommend you to go with TD Ameritrade or Fidelity.
Before investing, you have to choose the best ETFs or Index with a low expense ratio that is convenient for you.
Now you have to compare ETF funds in details like charges, return, and performance so you can pick the good one. You can also start with Fidelity and Vanguard S&P 500.
Enter username and password to log in at the trading app after that you can add or deposit your suitable amount in your brokerage account and ready to buy.
Finally, you can buy a fund in few clicks and after the unit is credited to the account, you are an ETF fund owner.
The S&P 500 is the Standard and Poor's 500 large-cap companies index which is available for publicly traded. Its biggest & popular indices represent the U.S Stock Market.
The S&P 500 consist of 500 companies but actual total stocks is 505 with different class of stocks.
S&P 500 is a safe way to invest for long-term stable returns because by investing in index, you invest in stocks that lead the world's biggest economy.
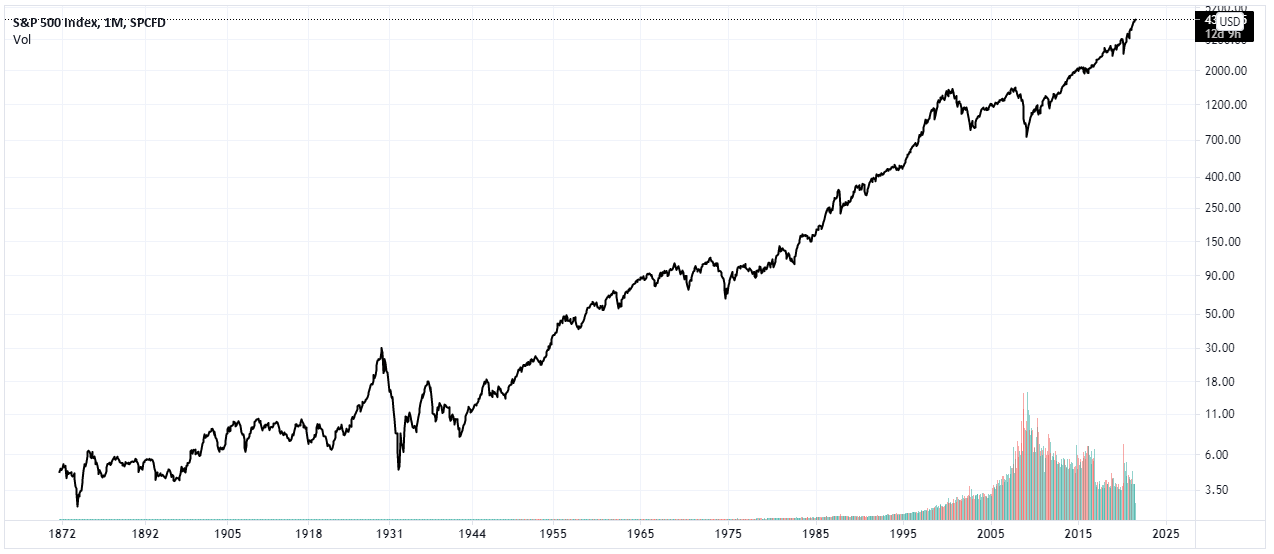
Historically, it has given 11-12% return
The average annual return of S&P 500 is 11% to 12% and the rest are given below -
|
|---|
The worst day was 19 Oct. 1987 (Black Monday) when the index fell 20.47% in a single day and the worst year is 2008 (Market Crash).

Share This Article
September 24, 2023
Artificial intelligence (AI) has infiltrated our society in the form of automation, machine learning, ...
September 24, 2023
ARKQ Holdings is an (ETF) fund that invests in the leading disruptive companies. Its ...
September 24, 2023
ARKF is an (ETF) Exchange Traded Fund that offers investors exposure to a world ...
September 24, 2023
$15.0CBOE Volatility Index What is Vix Index? Definition: One of the most recognizable measurements ...
September 24, 2023
What is the Dividend ETFs? Dividend ETFs are a basket of securities that pay ...
September 24, 2023
TickerARKW (ARK Next Generation Internet ETF) ARKW Price$76.2 Portfolio ManagerCatherine D. Wood Top HoldingsTesla, ...
September 24, 2023
The S&P 500 Dividend Aristocrats, established in 2005, consist of companies from the S&P ...
September 24, 2023
ARKX Holding (ETF) focuses on identifying companies and projects leading or positively contributing to ...
September 24, 2023
TickerARKG (ARK Genomic Revolution ETF) ARKG Price$23.2 Portfolio ManagerCatherine D. Wood Top HoldingsEXACT SCIENCES ...
September 24, 2023
The world population cross 8 billion number and more than 5 billion people have ...
September 24, 2023
In this post, you will learn all about Candlestick Price Chart to trade stocks, ...
September 24, 2023
The Volume Weighted Average Price (VWAP) Indicator provides the true intraday average price of ...