Dow Jones Industrial Average | DJIA Price Chart Today
Open High Low Close Change % Change 52 Week Range $38,114.7 $38,337.6 $38,065.1 $38,085.8 0.56% $214.8
Dow 30 Stocks
Here is the List of Dow 30 Stocks sorted by Market Cap, Stock Price, EPS, Dividend, and other performance factors. To know the weight of every company in the Dow Jones Index, check this post - Dow Jones Companies:
| Company | Price | Marketcap | Change % |
|---|---|---|---|
| UnitedHealth Group Incorporated | $496.3 | 456.6B | 0.49% |
| Goldman Sachs Group, Inc. (The) | $428.1 | 138.9B | 1.91% |
| Microsoft Corporation | $408.6 | 3.0T | 2.40% |
| Home Depot, Inc. (The) | $334.5 | 331.5B | 0.77% |
| McDonald's Corporation | $274.7 | 198.0B | 0.33% |
| Amgen Inc. | $271.3 | 145.5B | 0.70% |
| Visa Inc. | $274.5 | 561.6B | 0.25% |
| Boeing Company (The) | $167.1 | 102.5B | 0.14% |
| Caterpillar, Inc. | $344.9 | 172.2B | 2.03% |
| Salesforce, Inc. | $273.8 | 265.5B | 0.22% |
| Honeywell International Inc. | $192.7 | 125.5B | 0.16% |
| The Travelers Companies, Inc. | $214.4 | 49.1B | 0.21% |
| Chevron Corporation | $165.2 | 305.0B | 0.04% |
| Johnson & Johnson | $146.4 | 352.8B | 0.28% |
| Apple Inc. | $169.8 | 2.6T | 0.06% |
| American Express Company | $236.5 | 170.1B | 0.27% |
| Procter & Gamble Company (The) | $161.6 | 381.3B | 0.61% |
| Walmart Inc. | $60.2 | 485.1B | 0.01% |
| International Business Machines | $166.9 | 153.0B | 1.18% |
| JP Morgan Chase & Co. | $194.4 | 558.4B | 0.54% |
| Nike, Inc. | $94.1 | 142.0B | 0.12% |
| Merck & Company, Inc. | $131.5 | 333.0B | 0.56% |
| 3M Company | $91.9 | 50.9B | 0.53% |
| Walt Disney Company (The) | $112.3 | 205.9B | 0.46% |
| Coca-Cola Company (The) | $61.8 | 266.6B | 0.16% |
| Dow Inc. | $57.4 | 40.7B | 1.75% |
| Cisco Systems, Inc. | $48.0 | 194.3B | 0.24% |
| Verizon Communications Inc. | $39.8 | 167.4B | 1.42% |
| Walgreens Boots Alliance, Inc. | $17.7 | 15.3B | 0.80% |
| Intel Corporation | $31.7 | 135.1B | 9.60% |
What is the Dow Jones Index?
Dow Jones Industrial Average (^DJI) was launched in 1896 by Charles Dow and Edward Jones. It is a price-weighted index that tracks the performance of 30 large-cap U.S companies listed on the New York & Nasdaq stock exchange.

DJIA includes only a limited number of stocks, which are highly reputable, sustained growth-focused, and publicly tradable. Investors used this index over the century to understand the direction of the market and the U.S. economy. DJIA also referred as Dow 30 Stocks or blue-chip index, and companies include Microsoft, Walt Disney, Coca-Cola, 3M, and Nike.
Dow Jones Index Methodology
The Dow Jones Industrial Average is based on Price Weighted Method where the value of index is calculated based on the total price of all dow stocks divided by Dow Divisor.
(P = Total Price of Dow 30 Stocks)
(D = Dow Divisor)
Dow divisor is a important value to determine the level of DJIA index and avoid the impact of spinoffs, stock splits, and changes in the Dow constituents since inception.
For Example:
Assume that the total price of Dow stocks is $5000 and the current Dow Divisor is 0.147. So that means the index value is $34,013.60 ($5000/0.147), and every $1 change in any stock will impact the index with 6.58 points.
How Do Companies Get Added to The DJIA?
The Dow index was launched 125 years ago with 12 stocks, now the limit is 30 companies, and the components have changed 55 times since the inception.
So how do stocks get added to and removed from the Dow Jones Industrial Average?
DJIA doesn't have many rules like S&P 500 Index and has no annual or semi-annual reconstitution. All the changes are made on an as-needed basis by the Index Committee.
According to spglobal here are the main eligibility requirements for Dow Jones -
| Eligibility Required |
|---|
| The Dow index consists of securities in the S&P 500. |
| Excluding stocks classified under Global Industry Classification Standard (GICS) code 2030 (Transportation) and 55 (Utilities) |
| Company has an Excellent Reputation. |
| Demonstrates Sustained Growth Fouces. |
| Interest to a Large Number of Investors. |
| Companies Should be incorporated and headquartered in the U.S |
| Revenues should be derived from the U.S. |
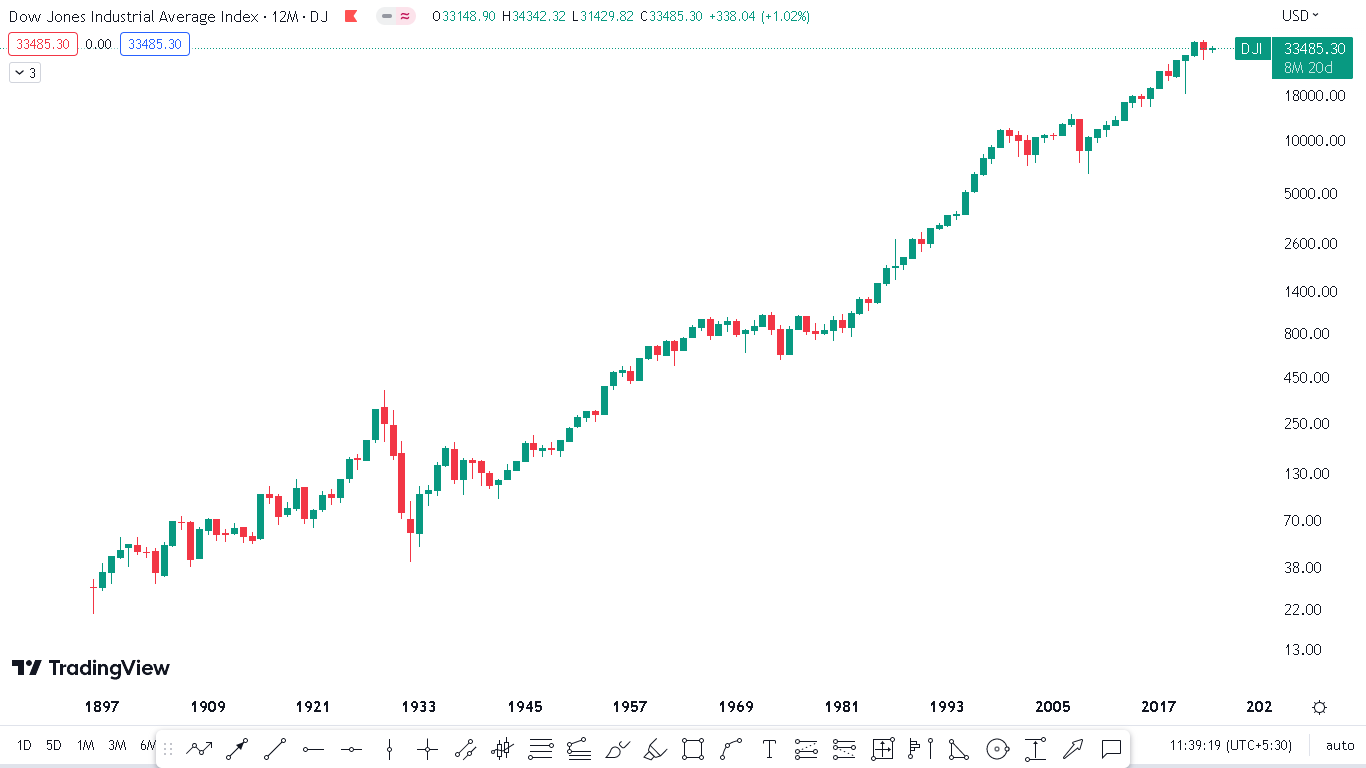
Dow Jones Historical Performance
Investors who want to invest in DJIA can check the Historical Performance of the Dow Jones Index.
| Year | Year Open | Year Close |
|---|---|---|
| 2023 | 33148.90 | |
| 2022 | 36321.59 | 33147.36 |
| 2021 | 30,627.47 | 36338.31 |
| 2020 | 28,868.80 | 30,606.48 |
| 2019 | 23,346.24 | 28,538.44 |
| 2018 | 24,824.01 | 23,327.46 |
| 2017 | 19,881.76 | 24,719.22 |
| 2016 | 17,148.94 | 19,762.60 |
| 2015 | 17,832.99 | 17,425.03 |
| 2014 | 16,441.35 | 17,823.07 |
| 2013 | 13,412.55 | 16,576.66 |
| 2012 | 12,397.38 | 13,104.14 |
| 2011 | 11,670.75 | 12,217.56 |
| 2010 | 10,583.96 | 11,577.51 |
| 2009 | 9,034.69 | 10,428.05 |
| 2008 | 13,043.96 | 8,776.39 |
| 2007 | 12,474.52 | 13,264.82 |
| 2006 | 10,847.41 | 12,463.15 |
| 2005 | 10,729.43 | 10,717.50 |
| 2004 | 10,409.85 | 10,783.01 |
| 2003 | 8,607.52 | 10,453.92 |
| 2002 | 10,073.40 | 8,341.63 |
| 2001 | 10,646.15 | 10,021.57 |
| 2000 | 11,357.51 | 10,787.99 |
| 1999 | 9,184.27 | 11,497.12 |
| 1998 | 7,965.00 | 9,181.43 |
| 1997 | 6,442.49 | 7,908.30 |
| 1996 | 5,177.45 | 6,448.27 |
| 1995 | 3,838.48 | 5,117.12 |
| 1994 | 3,756.60 | 3,834.44 |
| 1993 | 3,309.20 | 3,754.09 |
| 1992 | 3,172.40 | 3,301.11 |
| 1991 | 2,610.64 | 3,168.83 |
| 1990 | 2,810.15 | 2,633.66 |
| 1989 | 2,144.64 | 2,753.20 |
| 1988 | 2,015.25 | 2,168.57 |
| 1987 | 1,927.31 | 1,938.83 |
| 1986 | 1,537.73 | 1,895.95 |
| 1985 | 1,198.87 | 1,546.67 |
| 1984 | 1,252.74 | 1,211.57 |
| 1983 | 1,027.04 | 1,258.64 |
| 1982 | 882.52 | 1,046.54 |
| 1981 | 972.78 | 875.00 |
| 1980 | 824.57 | 963.99 |
| 1979 | 811.42 | 838.74 |
| 1978 | 817.74 | 805.01 |
| 1977 | 999.75 | 831.17 |
| 1976 | 858.71 | 1,004.65 |
| 1975 | 632.04 | 852.41 |
| 1974 | 855.32 | 616.24 |
| 1973 | 1,031.68 | 850.86 |
| 1972 | 889.30 | 1,020.02 |
| 1971 | 830.57 | 890.20 |
| 1970 | 809.20 | 838.92 |
| 1969 | 947.73 | 800.36 |
| 1968 | 906.84 | 943.75 |
| 1967 | 786.41 | 905.11 |
| 1966 | 968.54 | 785.69 |
| 1965 | 869.78 | 969.26 |
| 1964 | 766.08 | 874.13 |
| 1963 | 646.79 | 762.95 |
| 1962 | 724.71 | 652.10 |
| 1961 | 610.25 | 731.14 |
| 1960 | 679.06 | 615.89 |
| 1959 | 587.59 | 679.36 |
| 1958 | 439.27 | 583.65 |
| 1957 | 496.03 | 435.69 |
| 1956 | 485.78 | 499.47 |
| 1955 | 408.89 | 488.40 |
| 1954 | 282.89 | 404.39 |
| 1953 | 292.14 | 280.90 |
| 1952 | 269.86 | 291.90 |
| 1951 | 239.92 | 269.23 |
| 1950 | 198.89 | 235.41 |
| 1949 | 175.03 | 200.13 |
| 1948 | 181.04 | 177.30 |
| 1947 | 176.39 | 181.16 |
| 1946 | 191.66 | 177.20 |
| 1945 | 152.58 | 192.91 |
| 1944 | 135.92 | 152.32 |
| 1943 | 119.93 | 135.89 |
| 1942 | 112.77 | 119.40 |
| 1941 | 130.57 | 110.96 |
| 1940 | 151.43 | 131.13 |
| 1939 | 153.64 | 150.24 |
| 1938 | 120.57 | 154.76 |
| 1937 | 178.52 | 120.85 |
| 1936 | 144.13 | 179.90 |
| 1935 | 104.51 | 144.13 |
| 1934 | 100.36 | 104.04 |
| 1933 | 59.29 | 99.90 |
| 1932 | 74.62 | 59.93 |
| 1931 | 169.84 | 77.90 |
| 1930 | 244.20 | 164.58 |
| 1929 | 307.01 | 248.48 |
| 1928 | 203.35 | 300.00 |
| 1927 | 155.16 | 200.70 |
| 1926 | 151.08 | 157.20 |
| 1925 | 121.25 | 151.08 |
| 1924 | 95.65 | 120.51 |
| 1923 | 98.77 | 95.52 |
| 1922 | 78.91 | 98.17 |
| 1921 | 72.67 | 80.80 |
| 1920 | 107.23 | 71.95 |
| 1919 | 82.60 | 107.23 |
| 1918 | 76.68 | 82.20 |
| 1917 | 96.15 | 74.38 |
| 1916 | 98.81 | 95.00 |
| 1915 | 54.63 | 99.15 |

