CPI Inflation Rate is 3.70% (August 2023)
Latest Update 13th September 2023: In August 2023, the US Inflation Rate was 3.70% with a 307.03 Consumer Price Index (CPI).
Inflation has significantly decreased over the year, compared to the highest rate of 9.1% in June 2022. Reasons for the decrease in inflation are consistent hikes in interest rates and a decrease in energy prices.
Note: Inflation rates are usually tracked every month and published by government authorities – The August 2023 report is published on 13th September 2023 by the Bureau of Labor Statistics.
| Related | August | July | June | May | April |
|---|---|---|---|---|---|
| 💸 Inflation Rate | 3.70% | 3.20% | 3% | 4% | 4.9% |
| 📈 Consumer Price Index (CPI) | 307.03 | 305.69 | 305.11 | 304.13 | 303.36 |
| 🍔 Food Inflation | 4.30% | 4.90% | 5.70% | 6.70% | 7.70% |
| 👨🔧 Services Inflation | 5.40% | 5.70% | 5.74% | 6.30% | 6.80% |
| 🏘️ Rent Inflation | 7.27% | 7.70% | 7.80% | 8% | 8.10% |
| ⚡ Energy Inflation | 3.60% | -12.50% | -16.70% | -11.70% | -5.10% |
US Inflation Rates By Month (2000-2023)
The below chart displays US Inflation Rates for the last 23 years, and as you can see, the inflation rates are increasing in the previous two years, and rates jumped from 1.36% to 9.1% in the last year. If you want to calculate accumulated rates between two dates, use the US Inflation Calculator to understand how the purchasing power affects.
| Year | Jan | Feb | Mar | Apr | May | Jun | Jul | Aug | Sep | Oct | Nov | Dec |
|---|---|---|---|---|---|---|---|---|---|---|---|---|
| 2023 | 6.4 | 6.0 | 5.0 | 4.9 | 4 | 3 | 3.20 | 3.70 | ||||
| 2022 | 7.5 | 7.9 | 8.5 | 8.3 | 8.6 | 9.1 | 8.5 | 8.3 | 8.2 | 7.7 | 7.1 | 6.5 |
| 2021 | 1.4 | 1.7 | 2.6 | 4.2 | 5.0 | 5.4 | 5.4 | 5.3 | 5.4 | 6.2 | 6.8 | 7.0 |
| 2020 | 2.5 | 2.3 | 1.5 | 0.3 | 0.1 | 0.6 | 1.0 | 1.3 | 1.4 | 1.2 | 1.2 | 1.4 |
| 2019 | 1.6 | 1.5 | 1.9 | 2.0 | 1.8 | 1.6 | 1.8 | 1.7 | 1.7 | 1.8 | 2.1 | 2.3 |
| 2018 | 2.1 | 2.2 | 2.4 | 2.5 | 2.8 | 2.9 | 2.9 | 2.7 | 2.3 | 2.5 | 2.2 | 1.9 |
| 2017 | 2.5 | 2.7 | 2.4 | 2.2 | 1.9 | 1.6 | 1.7 | 1.9 | 2.2 | 2.0 | 2.2 | 2.1 |
| 2016 | 1.4 | 1.0 | 0.9 | 1.1 | 1.0 | 1.0 | 0.8 | 1.1 | 1.5 | 1.6 | 1.7 | 2.1 |
| 2015 | -0.1 | 0.0 | -0.1 | -0.2 | 0.0 | 0.1 | 0.2 | 0.2 | 0.0 | 0.2 | 0.5 | 0.7 |
| 2014 | 1.6 | 1.1 | 1.5 | 2.0 | 2.1 | 2.1 | 2.0 | 1.7 | 1.7 | 1.7 | 1.3 | 0.8 |
| 2013 | 1.6 | 2.0 | 1.5 | 1.1 | 1.4 | 1.8 | 2.0 | 1.5 | 1.2 | 1.0 | 1.2 | 1.5 |
| 2012 | 2.9 | 2.9 | 2.7 | 2.3 | 1.7 | 1.7 | 1.4 | 1.7 | 2.0 | 2.2 | 1.8 | 1.7 |
| 2011 | 1.6 | 2.1 | 2.7 | 3.2 | 3.6 | 3.6 | 3.6 | 3.8 | 3.9 | 3.5 | 3.4 | 3.0 |
| 2010 | 2.6 | 2.1 | 2.3 | 2.2 | 2.0 | 1.1 | 1.2 | 1.1 | 1.1 | 1.2 | 1.1 | 1.5 |
| 2009 | 0 | 0.2 | -0.4 | -0.7 | -1.3 | -1.4 | -2.1 | -1.5 | -1.3 | -0.2 | 1.8 | 2.7 |
| 2008 | 4.3 | 4.0 | 4.0 | 3.9 | 4.2 | 5.0 | 5.6 | 5.4 | 4.9 | 3.7 | 1.1 | 0.1 |
| 2007 | 2.1 | 2.4 | 2.8 | 2.6 | 2.7 | 2.7 | 2.4 | 2.0 | 2.8 | 3.5 | 4.3 | 4.1 |
| 2006 | 4.0 | 3.6 | 3.4 | 3.5 | 4.2 | 4.3 | 4.1 | 3.8 | 2.1 | 1.3 | 2.0 | 2.5 |
| 2005 | 3.0 | 3.0 | 3.1 | 3.5 | 2.8 | 2.5 | 3.2 | 3.6 | 4.7 | 4.3 | 3.5 | 3.4 |
| 2004 | 1.9 | 1.7 | 1.7 | 2.3 | 3.1 | 3.3 | 3.0 | 2.7 | 2.5 | 3.2 | 3.5 | 3.3 |
| 2003 | 2.6 | 3.0 | 3.0 | 2.2 | 2.1 | 2.1 | 2.1 | 2.2 | 2.3 | 2.0 | 1.8 | 1.9 |
| 2002 | 1.1 | 1.1 | 1.5 | 1.6 | 1.2 | 1.1 | 1.5 | 1.8 | 1.5 | 2.0 | 2.2 | 2.4 |
| 2001 | 3.7 | 3.5 | 2.9 | 3.3 | 3.6 | 3.2 | 2.7 | 2.7 | 2.6 | 2.1 | 1.9 | 1.6 |
| 2000 | 2.7 | 3.2 | 3.8 | 3.1 | 3.2 | 3.7 | 3.7 | 3.4 | 3.5 | 3.4 | 3.4 | 3.4 |
Related Post –
- Inflation Stimulus Relief to These States
- How Interest Rate Affects Stock Market
- Current 10-Year Bond Yield
What is the Inflation Rate?
The inflation rate is the pace at which prices increase inside an economy with time, and it can be calculated by comparing the cost of goods sold — also known as the Consumer Price Index (CPI).
Inflation Rate Formula = (Final CPI Index Value/Initial CPI Value)*100
The CPI is one of the most important key economic indicators in each country’s economy. It is a measure of consumer price inflation, that indicates the average price increase for a select basket of consumer goods and services over time.
Inflation hurts the purchasing power of money. This is one of the reasons that you see prices increasing over time. The inflation rate is a common measure of how fast the level of prices is rising or falling in an economy.
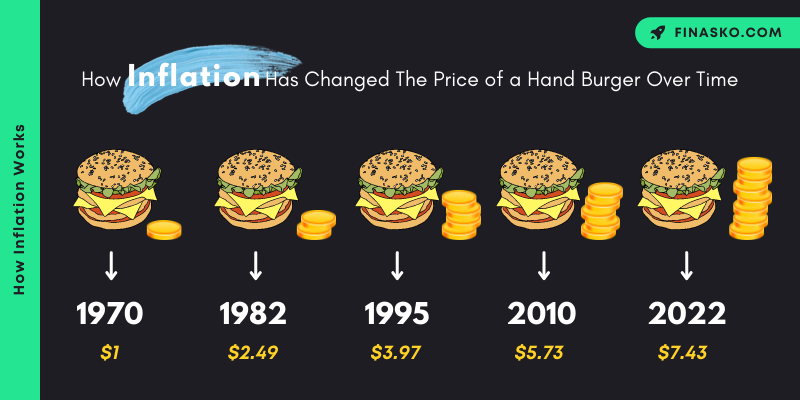
For Example – Let’s say you have $1 in your pocket during Jan 1970, and you wish to know how much $1 of January 1970 would be worth in June 2022. So we used this formula with CPI figures for the given two months.
Inflation Rate = (296.31/37.80)*100 = (7.838)*100 = 783.88%
A simpler statement of the same idea might be: The hand burger (as included in the CPI definition) you could buy for $1 in January 1970 would cost you $7.83 ($1×783.88%) in June 2022.
FAQ’s
Q. What is the U.S. inflation data release date?
The inflation data for the current month is expected to be released by government authorities between the 10th and 14th of the following month. For example, the data for June will be released at 8:00 am between July 10th.
Q. How Inflation Rate calculated?
Government agencies measure inflation with the help of a product basket. The basket includes items that are commonly bought by consumers, such as groceries, clothes, rent, power, communications, recreational activities, and raw materials (e.g., gas, oil), as well as federal fees and taxes.
Q. Which countries have the highest inflation rate?
Turkey (79.6%), Argentina (64%), Russia (15.9%), and Spain (10.8%) have the highest inflation.
Q. Why Inflation Rates Were So High In 2022?
When the demand for goods & services is higher but the supply sources can’t fulfill the requirement, this difference increases prices (Inflation). The most common reason for the current high inflation is the conflict between Ukraine-Russia, the Market Rally after Covid-19, and Money Pumping By the Government.
Q. Is Higher Inflation Causes The Recession?
The short answer is Yes. When inflation is high the Govt increases the Fed Rates which causes people to pay higher interest on credit, so they borrow less and spend less. That directly affects the demand and companies’ revenue, so they cut jobs, and GDP goes negative which is officially called a Recession.
Q. What’s the best way to Survive In a Recession?
These 3 points will help you to survive in a recession:
1. Watch Your Spending Habits – Only spend money when you needed.
2. Don’t Invest Blindly – Keep your SIP continue so that will help you in the long run.
3. Never Quit your Job – And increase the income sources that will support you during a recession.
0 Comments