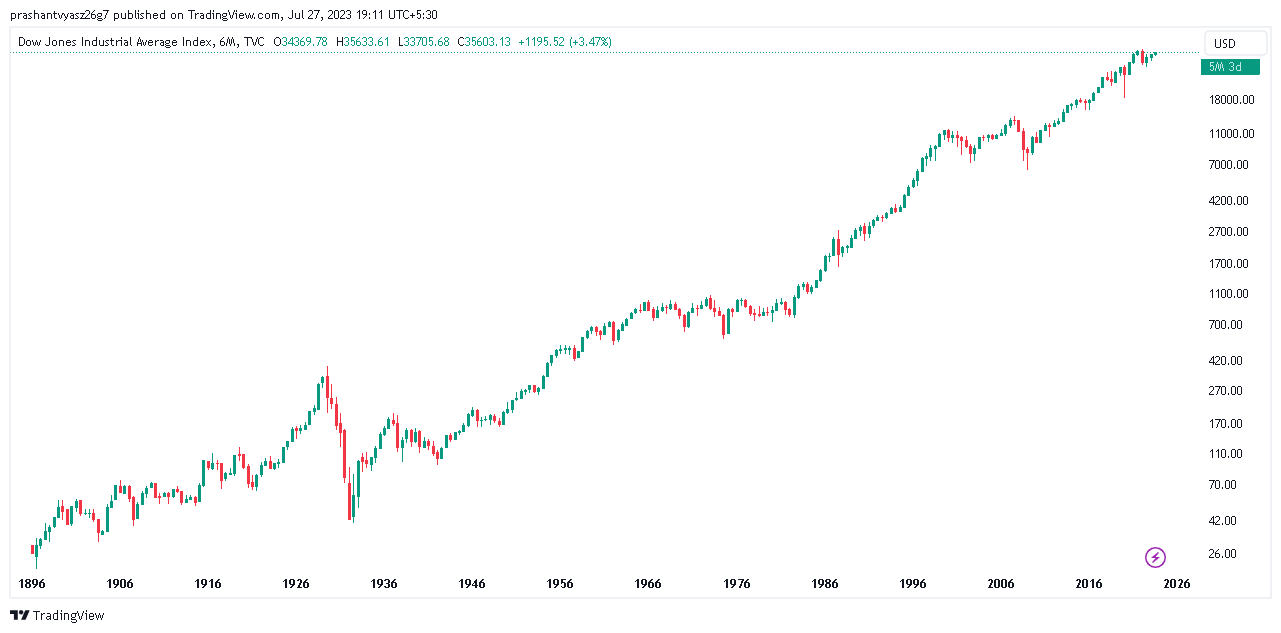
Dow Jones Chart
| Dow Jones | Cumulative Return |
|---|---|
| YTD (Till 22 Sep. 2023) | + 2.82% |
| 1 Year (2022) | – 8.78% |
| 5 Years (2018 – 2022) | + 66.74% |
| 10 Years (2013 – 2022) | + 152.68% |
| 20 Years (2003 – 2022) | + 296.15% |
| 30 Years (1993 – 2022) | + 904.61% |
| Biggest Gain (1915) | + 81.66.% |
| Biggest Fall (1931) | – 52.67% |
| Average Annual Return | +8% to +9% |
Dow Jones Industrial Average (DJIA) is the first stock market index created by Charles Dow in 1896, is the oldest stock market index, covering 30 price-weighted Blue Chip Stocks across major industries. It’s a popular indicator of global market trends, and investors use DJIA indices to predict market trends based on the Dow Theory.
Check out – S&P 500 Returns | Nadaq 100 Returns
Dow Jones Historical Annual Returns (1900-2023)
Check Out:- Dow Jones Stocks By Weight
| Year | Return |
|---|---|
| 2023 | 2.82% |
| 2022 | -8.78% |
| 2021 | 18.73% |
| 2020 | 7.25% |
| 2019 | 22.34% |
| 2018 | -5.63% |
| 2017 | 25.08% |
| 2016 | 13.42% |
| 2015 | -2.23% |
| 2014 | 7.52% |
| 2013 | 26.5% |
| 2012 | 7.26% |
| 2011 | 5.53% |
| 2010 | 11.02% |
| 2009 | 18.82% |
| 2008 | -33.84% |
| 2007 | 6.43% |
| 2006 | 16.29% |
| 2005 | -0.61% |
| 2004 | 3.15% |
| 2003 | 25.32% |
| 2002 | -16.76% |
| 2001 | -7.1% |
| 2000 | -6.18% |
| 1999 | 25.22% |
| 1998 | 16.1% |
| 1997 | 22.64% |
| 1996 | 26.01% |
| 1995 | 33.45% |
| 1994 | 2.14% |
| 1993 | 13.72% |
| 1992 | 4.17% |
| 1991 | 20.32% |
| 1990 | -4.34% |
| 1989 | 26.96% |
| 1988 | 11.85% |
| 1987 | 2.26% |
| 1986 | 22.58% |
| 1985 | 27.66% |
| 1984 | -3.74% |
| 1983 | 20.27% |
| 1982 | 19.6% |
| 1981 | -9.23% |
| 1980 | 14.94% |
| 1979 | 4.19% |
| 1978 | -3.15% |
| 1977 | -17.27% |
| 1976 | 17.86% |
| 1975 | 38.32% |
| 1974 | -27.57% |
| 1973 | -16.58% |
| 1972 | 14.58% |
| 1971 | 6.11% |
| 1970 | 4.82% |
| 1969 | -15.19% |
| 1968 | 4.27% |
| 1967 | 15.2% |
| 1966 | -18.94% |
| 1965 | 10.88% |
| 1964 | 14.57% |
| 1963 | 17% |
| 1962 | -10.81% |
| 1961 | 18.71% |
| 1960 | -9.34% |
| 1959 | 16.4% |
| 1958 | 33.96% |
| 1957 | -12.77% |
| 1956 | 2.27% |
| 1955 | 20.77% |
| 1954 | 43.96% |
| 1953 | -3.77% |
| 1952 | 8.42% |
| 1951 | 14.37% |
| 1950 | 17.63% |
| 1949 | 12.88% |
| 1948 | -2.13% |
| 1947 | 2.23% |
| 1946 | -8.14% |
| 1945 | 26.65% |
| 1944 | 12.09% |
| 1943 | 13.81% |
| 1942 | 7.61% |
| 1941 | -15.38% |
| 1940 | -12.72% |
| 1939 | -2.92% |
| 1938 | 28.06% |
| 1937 | -32.82% |
| 1936 | 24.82% |
| 1935 | 38.53% |
| 1934 | 4.14% |
| 1933 | 66.69% |
| 1932 | -23.07% |
| 1931 | -52.67% |
| 1930 | -33.77% |
| 1929 | -17.17% |
| 1928 | 48.22% |
| 1927 | 28.75% |
| 1926 | 0.34% |
| 1925 | 30% |
| 1924 | 26.16% |
| 1923 | -3.25% |
| 1922 | 21.74% |
| 1921 | 12.72% |
| 1920 | -32.9% |
| 1919 | 30.45% |
| 1918 | 10.51% |
| 1917 | -21.71% |
| 1916 | -4.19 |
| 1915 | 81.66% |
| 1914 | -5.43% |
| 1913 | -10.34% |
| 1912 | 7.58% |
| 1911 | 0.39% |
| 1910 | -17.86% |
| 1909 | 14.97% |
| 1908 | 46.64% |
| 1907 | -37.73% |
| 1906 | -1.92% |
| 1905 | 38.2% |
| 1904 | 41.74% |
| 1903 | -23.61% |
| 1902 | -0.42% |
| 1901 | -8.7% |
| 1900 | 7.01% |
0 Comments