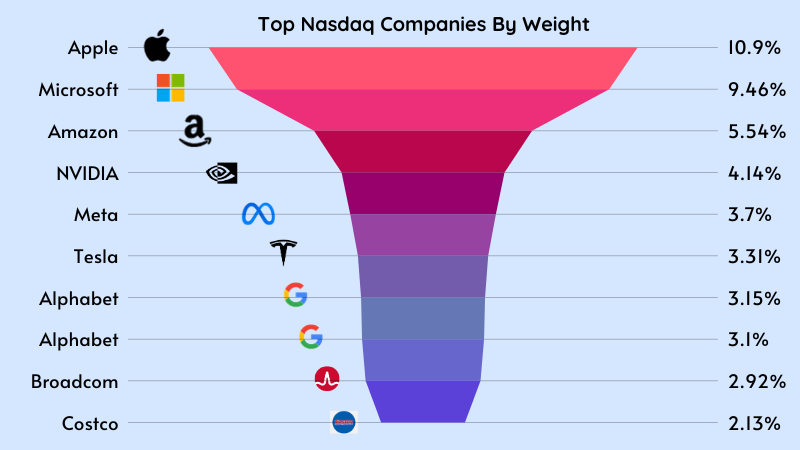
The Nasdaq-100 Index is a benchmark that tracks the performance of the top 100 US non-financial companies listed on the Nasdaq Exchange. Its unique methodology based on market capitalization ensures no company can have an outsized impact on the index.
With almost $15.40 trillion in market cap, the index has some of the most popular stocks like Apple, Microsoft, Alphabet, Intel, Facebook, Amazon, Starbucks, and Tesla. For those interested in investing in Tech Heavy Index, this Nasdaq 100 Companies list is a great place to start.
Nasdaq 100 Stocks List (2023)
| Company | Price | Marketcap | Change % |
|---|---|---|---|
| Microsoft Corporation | $413.5 | 3.1T | 1.69% |
| Apple Inc. | $181.7 | 2.8T | 0.91% |
| Amazon.com, Inc. | $188.7 | 2.0T | 1.34% |
| NVIDIA Corporation | $921.4 | 2.3T | 3.77% |
| Tesla, Inc. | $184.8 | 589.2B | 1.97% |
| Meta Platforms, Inc. | $465.7 | 1.2T | 3.04% |
| Alphabet Inc. | $169.8 | 2.1T | 0.50% |
| Alphabet Inc. | $168.1 | 2.1T | 0.51% |
| Broadcom Inc. | $1,310.3 | 607.2B | 2.52% |
| Pepsico, Inc. | $175.8 | 241.7B | 0.19% |
| Costco Wholesale Corporation | $756.5 | 335.5B | 1.69% |
| Cisco Systems, Inc. | $47.1 | 190.8B | 0.02% |
| T-Mobile US, Inc. | $162.4 | 190.3B | 1.35% |
| Comcast Corporation | $38.5 | 151.0B | 0.52% |
| Texas Instruments Incorporated | $181.7 | 165.4B | 1.54% |
| Adobe Inc. | $493.6 | 221.1B | 1.52% |
| Netflix, Inc. | $597.0 | 257.2B | 3.04% |
| QUALCOMM Incorporated | $181.9 | 202.9B | 1.23% |
| Honeywell International Inc. | $195.0 | 127.0B | 0.41% |
| Advanced Micro Devices, Inc. | $155.8 | 251.8B | 3.44% |
| Amgen Inc. | $299.5 | 160.7B | 3.79% |
| Starbucks Corporation | $72.9 | 82.6B | 0.29% |
| Intuit Inc. | $634.6 | 177.7B | 0.85% |
| Gilead Sciences, Inc. | $65.5 | 81.7B | 1.17% |
| Applied Materials, Inc. | $208.9 | 173.5B | 2.34% |
| Booking Holdings Inc. Common St | $3,598.4 | 122.1B | 0.59% |
| Analog Devices, Inc. | $203.3 | 100.8B | 1.85% |
| Automatic Data Processing, Inc. | $242.7 | 99.4B | 0.35% |
| Mondelez International, Inc. | $69.9 | 93.8B | 0.06% |
| PayPal Holdings, Inc. | $65.6 | 68.6B | 0.14% |
| Regeneron Pharmaceuticals, Inc. | $958.6 | 105.6B | 0.17% |
| Intuitive Surgical, Inc. | $383.1 | 135.9B | 0.44% |
| Vertex Pharmaceuticals Incorpor | $402.5 | 104.0B | 0.35% |
| Fiserv, Inc. | $114.2 | 0.0000 | 0.00% |
| Lam Research Corporation | $924.5 | 120.9B | 1.76% |
| CSX Corporation | $33.7 | 65.8B | 0.50% |
| Micron Technology, Inc. | $120.1 | 133.0B | 4.73% |
| MODERNA INC | $119.5 | 46.6B | 2.95% |
| Charter Communications, Inc. | $271.5 | 39.1B | 2.08% |
| Palo Alto Networks, Inc. | $300.6 | 97.1B | 1.47% |
| Synopsys, Inc. | $545.5 | 83.2B | 1.60% |
| ASML Holding N.V. - New York Re | $916.9 | 361.8B | 1.70% |
| KLA Corporation | $718.4 | 96.7B | 3.13% |
| Marriott International | $236.8 | 67.6B | 0.95% |
| Moderna, Inc. | $122.1 | 46.8B | 2.30% |
| Monster Beverage Corporation | $54.2 | 56.5B | 1.42% |
| Cadence Design Systems, Inc. | $285.2 | 77.6B | 1.26% |
| O'Reilly Automotive, Inc. | $1,016.1 | 60.0B | 0.31% |
| Airbnb, Inc. | $162.0 | 102.9B | 1.43% |
| Keurig Dr Pepper Inc. | $33.6 | 45.5B | 0.80% |
| The Kraft Heinz Company | $35.7 | 43.4B | 1.68% |
| Fortinet, Inc. | $58.8 | 44.9B | 0.12% |
| NXP Semiconductors N.V. | $259.6 | 66.4B | 0.69% |
| American Electric Power Company | $88.8 | 46.8B | 0.24% |
| Microchip Technology Incorporat | $93.8 | 50.7B | 2.63% |
| Cintas Corporation | $685.7 | 69.6B | 1.73% |
| Autodesk, Inc. | $216.7 | 46.4B | 0.70% |
| DexCom, Inc. | $129.7 | 51.6B | 1.00% |
| PDD Holdings Inc. | $138.6 | 192.5B | 1.10% |
| Exelon Corporation | $37.6 | 37.6B | 0.37% |
| Astrazeneca PLC | $75.8 | 234.9B | 0.77% |
| Paychex, Inc. | $120.6 | 43.4B | 0.44% |
| IDEXX Laboratories, Inc. | $476.9 | 39.4B | 0.78% |
| Biogen Inc. | $221.4 | 32.2B | 1.80% |
| Marvell Technology, Inc. | $69.8 | 60.5B | 1.91% |
| Ross Stores, Inc. | $132.5 | 44.4B | 1.25% |
| Warner Bros. Discovery, Inc. - | $8.0 | 19.5B | 0.13% |
| lululemon athletica inc. | $350.2 | 44.1B | 1.38% |
| PACCAR Inc. | $105.2 | 55.1B | 0.34% |
| Old Dominion Freight Line, Inc. | $180.2 | 39.2B | 2.64% |
| Workday, Inc. | $249.9 | 66.0B | 2.29% |
| GlobalFoundries Inc. | $49.7 | 27.5B | 0.93% |
| Xcel Energy Inc. | $54.4 | 30.2B | 0.20% |
| Copart, Inc. | $55.7 | 53.6B | 0.98% |
| $0.0000 | 0.0000 | 0.00% | |
| Cognizant Technology Solutions | $66.4 | 33.0B | 0.26% |
| Dollar Tree, Inc. | $120.2 | 26.2B | 0.46% |
| Illumina, Inc. | $119.0 | 18.9B | 0.89% |
| Walgreens Boots Alliance, Inc. | $17.3 | 14.9B | 3.09% |
| Baker Hughes Company | $32.0 | 32.1B | 0.25% |
| Electronic Arts Inc. | $130.6 | 34.9B | 0.77% |
| Fastenal Company | $66.7 | 38.2B | 2.47% |
| CoStar Group, Inc. | $91.3 | 37.3B | 0.08% |
| Enphase Energy, Inc. | $115.1 | 15.7B | 0.77% |
| Verisk Analytics, Inc. | $241.9 | 34.5B | 1.91% |
| ANSYS, Inc. | $321.6 | 28.1B | 0.65% |
| CrowdStrike Holdings, Inc. | $317.8 | 76.9B | 2.45% |
| eBay Inc. | $49.4 | 25.0B | 0.54% |
| Diamondback Energy, Inc. | $204.2 | 36.4B | 1.33% |
| Constellation Energy Corporatio | $197.7 | 62.3B | 1.46% |
| Atlassian Corporation | $181.8 | 47.3B | 0.95% |
| Align Technology, Inc. | $287.4 | 21.6B | 0.17% |
| Datadog, Inc. | $127.0 | 42.4B | 2.17% |
| JD.com, Inc. | $32.7 | 50.1B | 0.49% |
| Zscaler, Inc. | $178.1 | 26.7B | 0.58% |
| Zoom Video Communications, Inc. | $61.8 | 19.2B | 0.00% |
| Rivian Automotive, Inc. | $10.3 | 10.3B | 2.58% |
| Sirius XM Holdings Inc. | $3.2 | 12.2B | 1.92% |
| Lucid Group, Inc. | $3.1 | 7.0B | 9.52% |
Also, Check –
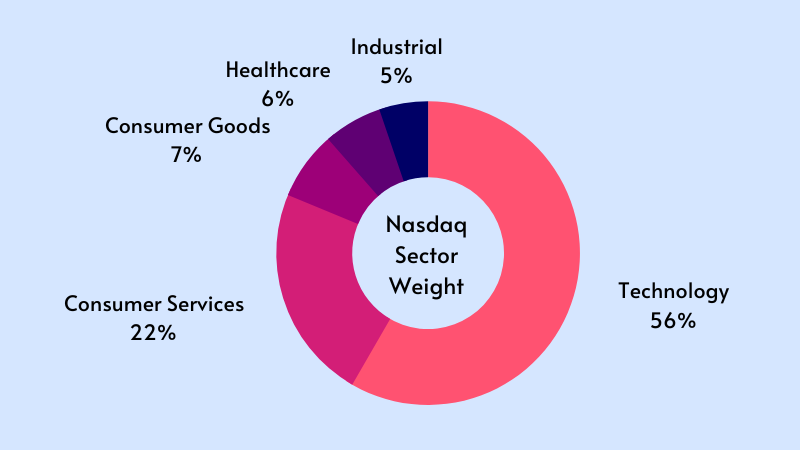
Nasdaq 100 Weight By Sector

The Nasdaq Composite is one of the most widely recognized indices tracking stocks in the United States. The index is compiled by the information technology field like Facebook, Apple, Microsoft, Tesla, and NVIDIA. The index mainly focused on the tech sector, which has more than 55% weight of entire indices, and that’s why we also call them tech-heavy index.
Check Out – Nasdaq 100 Historical Annual Return (1986-2023)
FAQ’s
Nasdaq 100 is the most popular index in the United States, based on the 100 largest non-financial US companies listed on Nasdaq Stock Exchange. It is a tech-heavy index (56%) and highly volatile compared to other indexes.
Nasdaq 100 average return is above 15%. (This is the highest average return provided by any index.)
Yes, in a nutshell, according to past performance. Whereas the S&P 500 has a 10% return and the Nasdaq-100 has an average return of 15% to 16% over the past 30 years. However, Nasdaq-100 has certain drawbacks, such as being extremely volatile and having the largest decline during a market meltdown.
The best way to invest in the NASDAQ-100 is to buy Nasdaq-100 ETFs (Exchange Trade Funds) which distribute your money in all 100 components according to their weight without any complication.
0 Comments