The S&P 500 Index is the largest Stock Market Index, containing 503 of the top companies in the world with a market worth of approximately $34.34 trillion. This index helps investors in determining the market direction and impacts the growth of the US economy.
The index is calculated based on the free-float market capitalization of the index constituents and covers almost 75-80% of all US Stock Market Capitalization. Over the past 90 years, the SP 500 Returns have been about 10%-11% annual average. The contribution or impact of every company in the index is equal to its weightage which is given below.
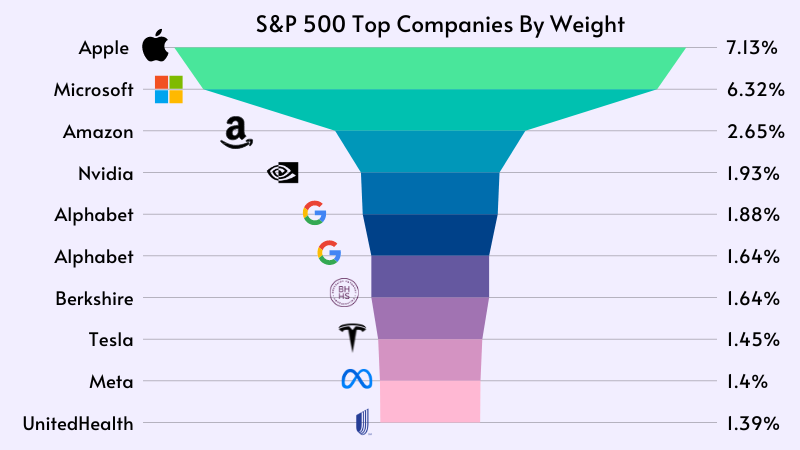
The top 10 holdings, with a combined value, are nearly $8.5 trillion, accounting for about 28.3% of the S&P 500’s capitalization. The Above weightage data helps you to understand what are the Blue Chip Stocks and which company impacts the index most.
| SP 500 Earnings |
| SP 500 Dividend Aristocrats |
| SP 500 PE Ratio & Valuation |
| SP 500 Historical Returns |
| SP 500 Dividend Kings |
Also, Check: –
Add the S&P 500 List in TradingView with one single click
To see the price chart of all the S&P 500 Stocks, you can add the entire stock list in Tradingview.
1. First, download this Excel list of S&P 500 companies.
2. Now open the file, copy all the symbols available in the E section (light pink),
3. Then go to Tradingview (add symbol option), select NYSE (Source), paste all symbols into that place, and finally Enter.
That’s it now you can access all 500 companies in Tradingview
List of S&P 500 Companies (2023)
| Stock | Price | Marketcap | Change % | Change | Volume | Open | High | Low | Close | 52 Week Range | Sector | Industry | EPS | Dividend Rate | Dividend Yield | Employees | Country | Last Updated |
|---|---|---|---|---|---|---|---|---|---|---|---|---|---|---|---|---|---|---|
 Apple Inc. AAPL | $182.4 | 2.8T | 0.38% | $0.69 | 72,868,843 | $183.5 | $184.9 | $181.3 | $181.7 | 6.4 | 1.0 | 0.5% | 0 | 10 hours ago | ||||
 Microsoft Corporation MSFT | $409.3 | 3.0T | 1.02% | $4.2 | 17,782,855 | $413.6 | $414.6 | $409.1 | $413.5 | 11.5 | 2.9 | 0.7% | 0 | 10 hours ago | ||||
 Amazon.com, Inc. AMZN | $188.8 | 2.0T | 0.03% | $0.06 | 33,185,160 | $188.9 | $189.9 | $187.3 | $188.7 | 3.6 | 0.0 | 0.0% | 0 | 10 hours ago | ||||
 NVIDIA Corporation NVDA | $905.5 | 2.3T | 1.72% | $15.9 | 43,368,185 | $910.9 | $917.8 | $823.3 | $921.4 | 12.0 | 0.2 | 0.0% | 0 | 10 hours ago | ||||
 Tesla, Inc. TSLA | $177.8 | 567.1B | 3.76% | $6.9 | 74,532,361 | $182.4 | $183.3 | $177.4 | $184.8 | 3.9 | 0.0 | 0.0% | 0 | 10 hours ago | ||||
 Berkshire Hathaway Inc. New BRK-B | $406.1 | 876.5B | 0.30% | $1.2 | 3,006,887 | $406.9 | $407.3 | $403.6 | $404.9 | 33.9 | 0.0 | 0.0% | 0 | 10 hours ago | ||||
 Alphabet Inc. GOOGL | $171.3 | 2.1T | 1.87% | $3.1 | 27,782,797 | $168.5 | $171.8 | $168.4 | $168.1 | 6.5 | 0.0 | 0.0% | 0 | 10 hours ago | ||||
 Alphabet Inc. GOOG | $173.0 | 2.1T | 1.85% | $3.1 | 20,896,975 | $170.3 | $173.5 | $170.0 | $169.8 | 6.5 | 0.0 | 0.0% | 0 | 10 hours ago | ||||
 Exxon Mobil Corporation XOM | $116.2 | 521.1B | 0.50% | $0.58 | 29,790,413 | $117.3 | $117.6 | $115.9 | $116.8 | 8.2 | 3.7 | 3.2% | 0 | 10 hours ago | ||||
 UnitedHealth Group Incorporated UNH | $501.0 | 460.9B | 1.33% | $6.6 | 3,746,532 | $496.0 | $501.7 | $495.0 | $494.4 | 16.4 | 7.5 | 1.5% | 0 | 10 hours ago | ||||
 JP Morgan Chase & Co. JPM | $191.8 | 550.6B | 0.13% | $0.25 | 7,475,900 | $191.7 | $192.9 | $191.7 | $192.0 | 16.6 | 4.3 | 2.2% | 0 | 10 hours ago | ||||
 Johnson & Johnson JNJ | $148.7 | 357.9B | 0.09% | $0.14 | 6,904,494 | $149.4 | $149.7 | $148.5 | $148.6 | 6.7 | 4.8 | 3.2% | 0 | 10 hours ago | ||||
 Meta Platforms, Inc. META | $468.2 | 1.2T | 0.55% | $2.6 | 13,377,537 | $466.4 | $471.5 | $461.3 | $465.7 | 17.4 | 0.5 | 0.1% | 0 | 10 hours ago | ||||
 Visa Inc. V | $276.5 | 565.7B | 1.39% | $3.8 | 6,324,667 | $273.7 | $277.9 | $272.8 | $272.7 | 8.9 | 2.0 | 0.7% | 0 | 10 hours ago | ||||
 Procter & Gamble Company (The) PG | $165.8 | 391.2B | 0.80% | $1.3 | 6,374,242 | $165.0 | $166.0 | $164.6 | $164.4 | 6.1 | 3.8 | 2.3% | 0 | 10 hours ago | ||||
 Home Depot, Inc. (The) HD | $340.7 | 337.6B | 0.47% | $1.6 | 2,867,116 | $343.6 | $345.5 | $340.4 | $342.3 | 15.1 | 8.5 | 2.5% | 0 | 10 hours ago | ||||
 Mastercard Incorporated MA | $453.1 | 421.2B | 0.82% | $3.7 | 2,338,673 | $451.8 | $453.3 | $447.5 | $449.4 | 12.6 | 2.5 | 0.5% | 0 | 10 hours ago | ||||
 Chevron Corporation CVX | $162.7 | 299.8B | 0.23% | $0.37 | 6,673,596 | $162.3 | $163.2 | $162.0 | $162.3 | 10.9 | 6.2 | 3.8% | 0 | 10 hours ago | ||||
 AbbVie Inc. ABBV | $162.6 | 287.0B | 0.11% | $0.18 | 5,281,990 | $164.4 | $164.0 | $161.9 | $162.7 | 3.4 | 6.1 | 3.7% | 0 | 10 hours ago | ||||
 Merck & Company, Inc. MRK | $130.4 | 330.2B | 2.20% | $2.8 | 6,650,573 | $127.1 | $130.4 | $127.1 | $127.6 | 0.9 | 3.0 | 2.3% | 0 | 10 hours ago | ||||
 Eli Lilly and Company LLY | $777.8 | 739.2B | 1.45% | $11.1 | 2,842,406 | $768.9 | $779.1 | $762.1 | $766.7 | 6.8 | 4.7 | 0.6% | 0 | 10 hours ago | ||||
 Broadcom Inc. AVGO | $1,303.1 | 603.9B | 0.55% | $7.2 | 1,238,777 | $1,316.4 | $1,319.0 | $1,296.8 | $1,310.3 | 27.0 | 19.7 | 1.5% | 0 | 10 hours ago | ||||
 Bank of America Corporation BAC | $37.8 | 295.9B | 0.40% | $0.15 | 27,952,611 | $37.7 | $38.1 | $37.7 | $37.7 | 2.9 | 0.9 | 2.5% | 0 | 10 hours ago | ||||
 Pepsico, Inc. PEP | $178.0 | 244.7B | 1.25% | $2.2 | 3,391,720 | $177.0 | $178.2 | $176.5 | $175.8 | 6.6 | 5.1 | 2.9% | 0 | 10 hours ago | ||||
 Coca-Cola Company (The) KO | $62.6 | 269.8B | 0.43% | $0.27 | 9,656,652 | $62.8 | $62.8 | $62.3 | $62.4 | 2.5 | 1.9 | 3.0% | 0 | 10 hours ago | ||||
 Pfizer, Inc. PFE | $27.8 | 157.2B | 1.38% | $0.39 | 61,156,810 | $28.3 | $28.5 | $27.4 | $28.2 | 0.1 | 1.7 | 5.9% | 0 | 10 hours ago | ||||
 Costco Wholesale Corporation COST | $771.3 | 342.1B | 1.96% | $14.9 | 1,894,448 | $758.8 | $772.2 | $755.6 | $756.5 | 15.3 | 4.1 | 0.5% | 0 | 10 hours ago | ||||
 Thermo Fisher Scientific Inc TMO | $572.9 | 218.7B | 0.12% | $0.68 | 1,771,702 | $575.4 | $576.6 | $565.3 | $573.6 | 15.6 | 1.4 | 0.3% | 0 | 10 hours ago | ||||
 Walmart Inc. WMT | $60.6 | 488.6B | 1.25% | $0.75 | 14,277,223 | $60.2 | $60.8 | $60.1 | $59.9 | 1.9 | 0.8 | 1.3% | 0 | 10 hours ago | ||||
 Cisco Systems, Inc. CSCO | $47.3 | 191.4B | 0.36% | $0.17 | 14,134,709 | $47.2 | $47.5 | $47.0 | $47.1 | 3.3 | 1.6 | 3.3% | 0 | 10 hours ago | ||||
 McDonald's Corporation MCD | $267.5 | 192.9B | 0.67% | $1.8 | 3,140,859 | $270.0 | $270.7 | $267.0 | $269.3 | 11.8 | 6.4 | 2.4% | 0 | 10 hours ago | ||||
 Walt Disney Company (The) DIS | $105.4 | 192.1B | 9.51% | $11.1 | 54,679,301 | $107.3 | $107.9 | $104.2 | $116.5 | 1.6 | 0.3 | 0.3% | 0 | 10 hours ago | ||||
 Wells Fargo & Company WFC | $60.3 | 210.1B | 0.12% | $0.07 | 16,249,673 | $60.3 | $60.6 | $60.1 | $60.2 | 4.8 | 1.4 | 2.2% | 0 | 10 hours ago | ||||
 Abbott Laboratories ABT | $106.2 | 184.7B | 0.50% | $0.53 | 6,456,200 | $106.5 | $106.6 | $105.8 | $105.6 | 3.2 | 2.1 | 2.0% | 0 | 10 hours ago | ||||
 Linde plc LIN | $430.0 | 206.7B | 0.79% | $3.4 | 1,537,443 | $429.7 | $437.9 | $427.5 | $426.6 | 12.9 | 5.2 | 1.2% | 0 | 10 hours ago | ||||
 Accenture plc ACN | $310.7 | 195.3B | 1.50% | $4.6 | 2,304,642 | $307.9 | $312.1 | $307.6 | $306.1 | 11.0 | 5.0 | 1.6% | 0 | 10 hours ago | ||||
 Salesforce, Inc. CRM | $277.2 | 268.9B | 0.56% | $1.5 | 3,494,831 | $275.6 | $278.9 | $274.1 | $275.6 | 4.2 | 0.0 | 0.0% | 0 | 10 hours ago | ||||
 Verizon Communications Inc. VZ | $39.3 | 165.5B | 0.05% | $0.02 | 10,759,939 | $39.5 | $39.6 | $39.1 | $39.3 | 2.7 | 2.6 | 6.7% | 0 | 10 hours ago | ||||
 Danaher Corporation DHR | $248.8 | 184.3B | 0.55% | $1.4 | 1,584,325 | $246.5 | $249.1 | $246.2 | $247.4 | 5.5 | 1.1 | 0.4% | 0 | 10 hours ago | ||||
 Comcast Corporation CMCSA | $38.5 | 151.0B | 0.00% | $0.0000 | 26,040,252 | $38.6 | $38.7 | $38.4 | $38.5 | 3.8 | 1.2 | 3.1% | 0 | 10 hours ago | ||||
 Texas Instruments Incorporated TXN | $182.7 | 166.3B | 1.28% | $2.3 | 5,152,667 | $181.8 | $183.6 | $181.7 | $180.4 | 6.4 | 5.1 | 2.8% | 0 | 10 hours ago | ||||
 Adobe Inc. ADBE | $492.3 | 220.5B | 0.27% | $1.3 | 2,347,126 | $492.5 | $496.8 | $489.2 | $493.6 | 10.5 | 0.0 | 0.0% | 0 | 10 hours ago | ||||
 Philip Morris International Inc PM | $97.5 | 151.6B | 0.08% | $0.08 | 3,921,871 | $98.0 | $98.4 | $97.4 | $97.5 | 5.1 | 5.2 | 5.3% | 0 | 10 hours ago | ||||
 Nike, Inc. NKE | $93.8 | 141.5B | 0.45% | $0.42 | 7,027,283 | $94.1 | $94.3 | $93.2 | $93.4 | 3.4 | 1.4 | 1.5% | 0 | 10 hours ago | ||||
 Bristol-Myers Squibb Company BMY | $44.0 | 89.3B | 0.32% | $0.14 | 10,924,171 | $44.0 | $44.3 | $43.8 | $43.9 | 3.1 | 2.3 | 5.3% | 0 | 10 hours ago | ||||
 RTX Corporation RTX | $103.2 | 137.2B | 1.30% | $1.3 | 6,870,450 | $102.3 | $103.3 | $102.1 | $101.9 | 2.5 | 2.4 | 2.3% | 0 | 10 hours ago | ||||
 Netflix, Inc. NFLX | $606.0 | 261.1B | 1.51% | $9.0 | 3,606,199 | $596.3 | $606.1 | $591.3 | $597.0 | 14.4 | 0.0 | 0.0% | 0 | 10 hours ago | ||||
 NextEra Energy, Inc. NEE | $72.0 | 147.8B | 0.98% | $0.7 | 13,416,326 | $71.7 | $72.0 | $71.3 | $71.3 | 3.7 | 1.9 | 2.7% | 0 | 10 hours ago | ||||
 QUALCOMM Incorporated QCOM | $180.2 | 201.0B | 0.93% | $1.7 | 7,642,128 | $182.4 | $184.3 | $179.3 | $181.9 | 7.5 | 3.2 | 1.8% | 0 | 10 hours ago | ||||
 ConocoPhillips COP | $123.5 | 144.5B | 0.01% | $0.01 | 5,529,357 | $123.7 | $124.9 | $123.1 | $123.6 | 8.8 | 4.2 | 3.4% | 0 | 10 hours ago | ||||
 AT&T Inc. T | $17.1 | 122.5B | 0.53% | $0.09 | 27,409,069 | $17.1 | $17.2 | $17.0 | $17.0 | 1.9 | 1.1 | 6.5% | 0 | 10 hours ago |
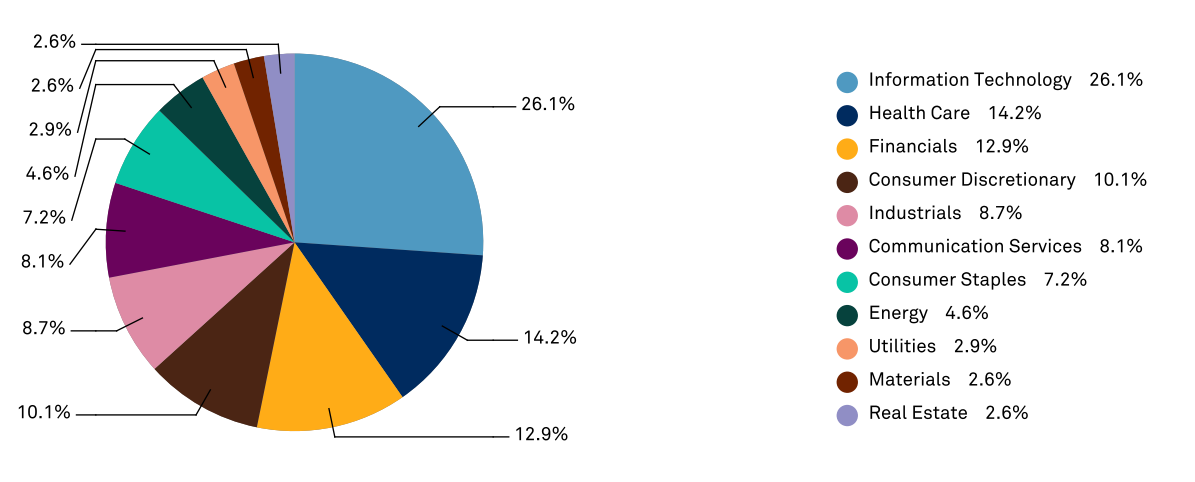
S&P 500 Sector Weightage
As of March 2023, the S&P 500 sector weightage by total market capitalization was: Energy (4.6%), Industrials (8.7%), Technology (26.1%), Consumer Durable (10.1%), Consumer Staples (7.2%), Health Care (14.2%) and Financials (12.9%).
Recent Changes in S&P 500
| DATE | COMPANY ADDED | COMPANY REMOVED |
|---|---|---|
| 20 Mar 2023 | Fair Isaac | Lumen Technologies |
| 15 Mar 2023 | Bunge Limited | Signature Bank |
| 15 Mar 2023 | Insulet | SVB Financial Group |
| 05 Jan 2023 | — | Vornado Realty Trust |
| 04 Jan 2023 | GE HealthCare | — |
| 22 Dec 2022 | Steel Dynamics | Abiomed |
| 19 Dec 2022 | First Solar | Fortune Brands Home & Security |
| 19 Dec 2022 | — | MasterBrand |
| 15 Dec 2022 | MasterBrand | — |
| 01 Nov 2022 | Arch Capital Group | |
| 12 Oct 2022 | Targa Resources | Nielsen Holdings |
| 03 Oct 2022 | PG&E | Citrix Systems |
| 03 Oct 2022 | EQT | Duke Realty |
| 19 Sep 2022 | CoStar Group | PVH |
| 19 Sep 2022 | Invitation Homes | Penn Entertainment |
| 21 June 2022 | — | Under Armour |
| 21 June 2022 | Keurig Dr. Pepper | Under Armour |
| 21 June 2022 | ON Semiconductor | IPG Photonics |
| 8 June 2022 | Vici Properties | Cerner |
| 4 April 2022 | Camden | People’s United Financial |
| 2 Mar 2022 | Molina Healthcare | IHS Markit |
| 15 Feb 2022 | Nordson | Xilinx |
| 3 Feb 2022 | — | Gap |
| 2 Feb 2022 | Constellation Energy | — |
| 20 Dec 2021 | Signature Bank | Leggett & Platt |
| 20 Dec 2021 | SolarEdge | Hanesbrands |
| 20 Dec 2021 | FactSet | Western Union |
| 14 Dec 2021 | EPAM Systems | Kansas City Southern |
| 20 Sep 2021 | Match Group | Perrigo |
| 20 Sep 2021 | Ceridian | Unum |
| 20 Sep 2021 | Brown & Brown | Nov |
| 30 Aug 2021 | Bio-Techne | Maxim Integrated |
| 21 June 2021 | Moderna | Alexion Pharmaceuticals |
| 4 June 2021 | — | HollyFrontier |
| 3 June 2021 | Organon & Co. | — |
| 14 May 2021 | Charles River Laboratories | FLIR Systems |
FAQ’s
The Standard and Poor’s 500, is the largest index in the world. The index includes the 500 most valuable multinational corporations and is considered a tool for monitoring the US economy.
The two largest industries, with an index market size of about $15 trillion, are information technology (26.1%) and health care (14.2%).
Yes. Many businesses in the SP 500 index regularly distribute dividends to their shareholders. If you want to know how much dividends are paid by SP 500 then check out the Index Dividend Yield, which is calculated from the index price and the aggregate dividend paid by all 500 companies.
According to historical data, the SP 500 provided an Average Price Return
10% – 11%, Inflation Adjusted Return 8% – 8.5% and Dividend Reinvested Return 12%.
According to Warren Buffett (Great Investor), “The best thing people can do is to own the S&P 500 index fund”. And he is right because 80% to 90% of fund managers can’t beat the passive index funds, which provided a 10% to 11% historically CAGR in the last 100. So Yes, the SP 500 Index is a good investment.
The best way to invest in the Standard and Poor’s 500 is to buy SP 500 ETFs (Exchange Trade Funds) or Index funds, which distribute your money in all 500 components according to their weight without any complication, also you can buy & sell these ETF’s any time like stocks.
1. SPDR S&P 500 ETF Trust (SPY)
2. iShares Core S&P 500 ETF (IVV)
3. Vanguard 500 Index Fund (VOO)
2 Comments