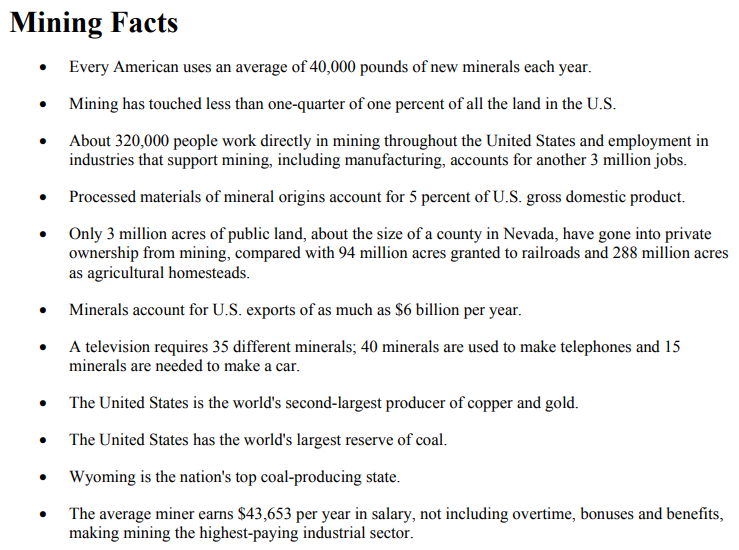
The mining industry has made a huge impact on society, including exploration and production of minerals and metals, valued at $553 billion in the US. The industry includes large corporations and small exploration companies that search for new sources of metal ores. Some metals included gold, silver, iron ore, lithium, lead, tin, and zinc.

Largest Mining Companies In The World
If you are interested in this sector and want to know which top companies are, then here is the list you can find…
- Mining Company Name
- Current Market Cap & Price
- Open, High, Low, Close
- 52 Week Range
- EPS and Dividend
- Employees Number
- Country Name
Check – Renewable Energy Stocks
| Stock | Marketcap | Price | Change % | Change | Volume | Sector | Industry | Open | High | Low | Close | 52 Week Range | EPS | Dividend Rate | Dividend Yield | Employees | Country | Last Updated |
|---|---|---|---|---|---|---|---|---|---|---|---|---|---|---|---|---|---|---|
BHP Group Limited BHP | 145.7B | $57.5 | 1.07% | $0.61 | 2,040,874 | $57.6 | $57.7 | $57.3 | $56.9 | 2.9 | 1.5 | 2.7% | 0 | 10 hours ago | ||||
Rio Tinto Plc RIO | 113.7B | $70.0 | 0.32% | $0.22 | 2,030,510 | $70.0 | $70.4 | $70.0 | $69.8 | 6.2 | 4.3 | 6.2% | 0 | 10 hours ago | ||||
 GLENCORE PLC GLCNF | 71.0B | $5.8 | 0.26% | $0.015 | 327,361 | $5.8 | $5.9 | $5.8 | $5.8 | 0.3 | 0.1 | 2.2% | 0 | 10 hours ago | ||||
 VALE S.A. VALE | 54.3B | $12.7 | 0.79% | $0.1 | 23,806,516 | $12.8 | $12.9 | $12.7 | $12.6 | 1.8 | 7.0 | 55.5% | 0 | 10 hours ago | ||||
 CHINA SHENHUA ENERGY COMPANY LT CSUAY | 107.5B | $17.3 | 0.76% | $0.13 | 10,923 | $17.2 | $17.3 | $17.2 | $17.1 | 1.6 | 2.3 | 13.2% | 0 | 10 hours ago | ||||
 ANGLO PLC AAM.SW | 45.7B | $34.2 | 8.39% | $2.6 | 200 | $34.2 | $34.2 | $34.2 | $31.5 | 0.2 | 1.0 | 3.4% | 0 | 20 hours ago | ||||
 Freeport-McMoRan, Inc. FCX | 74.0B | $51.4 | 0.78% | $0.4 | 13,065,641 | $51.0 | $51.5 | $50.8 | $51.0 | 1.1 | 0.6 | 1.2% | 0 | 10 hours ago | ||||
 Southern Copper Corporation SCCO | 89.9B | $115.1 | 1.49% | $1.7 | 919,057 | $116.1 | $116.7 | $114.8 | $116.8 | 3.0 | 3.8 | 3.2% | 0 | 10 hours ago | ||||
 Newmont Corporation NEM | 47.8B | $41.4 | 0.12% | $0.05 | 7,194,954 | $41.4 | $41.7 | $41.2 | $41.4 | 3.3 | 1.3 | 3.1% | 0 | 10 hours ago | ||||
 FORTESCUE FPO [FMG] FMG.AX | 54.1B | $17.6 | 0.90% | $0.159 | 1,993,730 | $17.8 | $17.8 | $17.5 | $17.7 | 2.8 | 1.4 | 5.2% | 0 | 20 mins ago | ||||
 NILSY | 0.0000 | $0.0000 | 0.00% | $0.0000 | 0 | $0.0000 | $0.0000 | $0.0000 | $0.0000 | 0.0 | 0.0 | 0.0% | 0 | 54 years ago | ||||
 ZIJIN MINING GROUP CO.LTD 601899.SS | 62.8B | $2.4 | 0.86% | $0.0208 | 98,222,199 | $2.4 | $2.4 | $2.4 | $2.4 | 0.8 | 0.3 | 1.4% | 0 | 15 mins ago | ||||
 Nutrien Ltd. NTR | 27.4B | $55.3 | 2.31% | $1.3 | 1,582,084 | $54.1 | $55.3 | $54.0 | $54.0 | 2.5 | 2.1 | 3.9% | 0 | 10 hours ago | ||||
 Barrick Gold Corporation GOLD | 29.5B | $16.7 | 0.42% | $0.07 | 12,479,413 | $16.6 | $16.8 | $16.5 | $16.7 | 0.8 | 0.3 | 1.8% | 0 | 10 hours ago | ||||
 Franco-Nevada Corporation FNV | 24.3B | $126.0 | 0.13% | $0.17 | 577,976 | $125.9 | $126.9 | $125.2 | $126.2 | 2.5 | 1.4 | 1.1% | 0 | 10 hours ago | ||||
 Teck Resources Ltd TECK | 26.2B | $50.3 | 0.90% | $0.45 | 2,473,705 | $49.9 | $50.5 | $49.8 | $49.9 | 2.2 | 0.5 | 1.0% | 0 | 10 hours ago | ||||
 VEDANTA LIMITED VEDL.NS | 0.018T | $4.8 | 1.87% | $0.0887 | 4,064,463 | $4.7 | $4.9 | $4.7 | $4.7 | 12.6 | 0.0 | 0.0% | 0 | 14 seconds ago | ||||
 SOUTH32 FPO [S32] S32.AX | 10.9B | $2.4 | 0.14% | $0.0033 | 6,945,310 | $2.4 | $2.4 | $2.4 | $2.4 | 0.3 | 0.0 | 1.0% | 0 | 20 mins ago | ||||
 COAL INDIA LTD COALINDIA.NS | 0.0343T | $5.6 | 1.92% | $0.1048 | 7,315,274 | $5.5 | $5.6 | $5.5 | $5.5 | 60.7 | 25.5 | 5.6% | 0 | 15 seconds ago | ||||
 SHANDONG GOLD MINING CO LTD 600547.SS | 17.0B | $4.2 | 1.80% | $0.0735 | 17,973,706 | $4.1 | $4.2 | $4.0 | $4.1 | 0.5 | 0.1 | 0.5% | 0 | 15 mins ago | ||||
 Boliden AB BOL.ST | 9.2B | $33.5 | 0.08% | $0.0277 | 1,075,452 | $33.6 | $33.7 | $32.9 | $33.5 | 17.1 | 7.5 | 2.1% | 0 | 14 hours ago | ||||
 D/B/A Sibanye-Stillwater Limite SBSW | 3.5B | $4.9 | 0.82% | $0.04 | 3,763,483 | $4.9 | $5.0 | $4.9 | $4.9 | 2.9 | 0.5 | 10.9% | 0 | 10 hours ago | ||||
 Gold Fields Limited GFI | 14.8B | $15.9 | 3.99% | $0.66 | 3,457,642 | $15.7 | $16.0 | $15.5 | $16.6 | 0.8 | 0.4 | 2.5% | 0 | 10 hours ago | ||||
 AngloGold Ashanti PLC AU | 9.9B | $23.6 | 1.13% | $0.27 | 1,351,491 | $23.5 | $23.7 | $23.3 | $23.8 | 0.1 | 0.2 | 1.0% | 0 | 10 hours ago | ||||
 Bayan Resources Tbk BYAN.JK | 0.0393T | $1.2 | 0.66% | $0.0078 | 14,800 | $1.2 | $1.2 | $1.2 | $1.2 | 643.9 | 0.0 | 0.0% | 0 | 51 mins ago | ||||
 Cameco Corporation CCJ | 22.6B | $51.8 | 2.01% | $1.0 | 6,423,791 | $51.5 | $52.8 | $51.0 | $50.7 | 0.4 | 0.1 | 0.2% | 0 | 10 hours ago | ||||
 KGHM POLSKA MIEDZ ZY 10 KGHA.F | 7.2B | $36.1 | 1.39% | $0.4953 | 319 | $35.8 | $36.1 | $35.6 | $35.6 | 4.3 | 0.0 | 0.0% | 0 | 10 hours ago | ||||
 Kinross Gold Corporation KGC | 8.4B | $6.8 | 0.30% | $0.02 | 10,900,647 | $6.7 | $6.8 | $6.7 | $6.8 | 0.3 | 0.1 | 1.8% | 0 | 10 hours ago |
Note:- Some companies’ market caps are available in different formats like Bayan Resources Tbk. (0.0082T) and MOIL LTD (0.5498B), which means the same as Bayan Resources Tbk. 8.20B and MOIL LTD 549.8B.
0 Comments