
What is the Renewable Energy?
Renewable energy or clean energy refers to energy sources that are replaced rapidly by natural processes, such as sunlight, wind, rain, and tides. In simple terms, renewable can be used to describe any source of energy that is not depleted when used, these include conventional power generation methods such as solar panels and wind farms, biomass, hydroelectric, as well as newer technology such as electric cars.
Stock to Watch – 5G Stocks | AI Stocks
Should You Invest In Green Energy?
Renewable energy stocks can be quite profitable if you get involved with the right company. While this is still a young industry, there are already plenty of opportunities for dedicated investors. Some have been around for decades, others are brand new to the market, but all of them are making positive strides in the right direction.
Talk about the fundamentals here is a quick view of data:
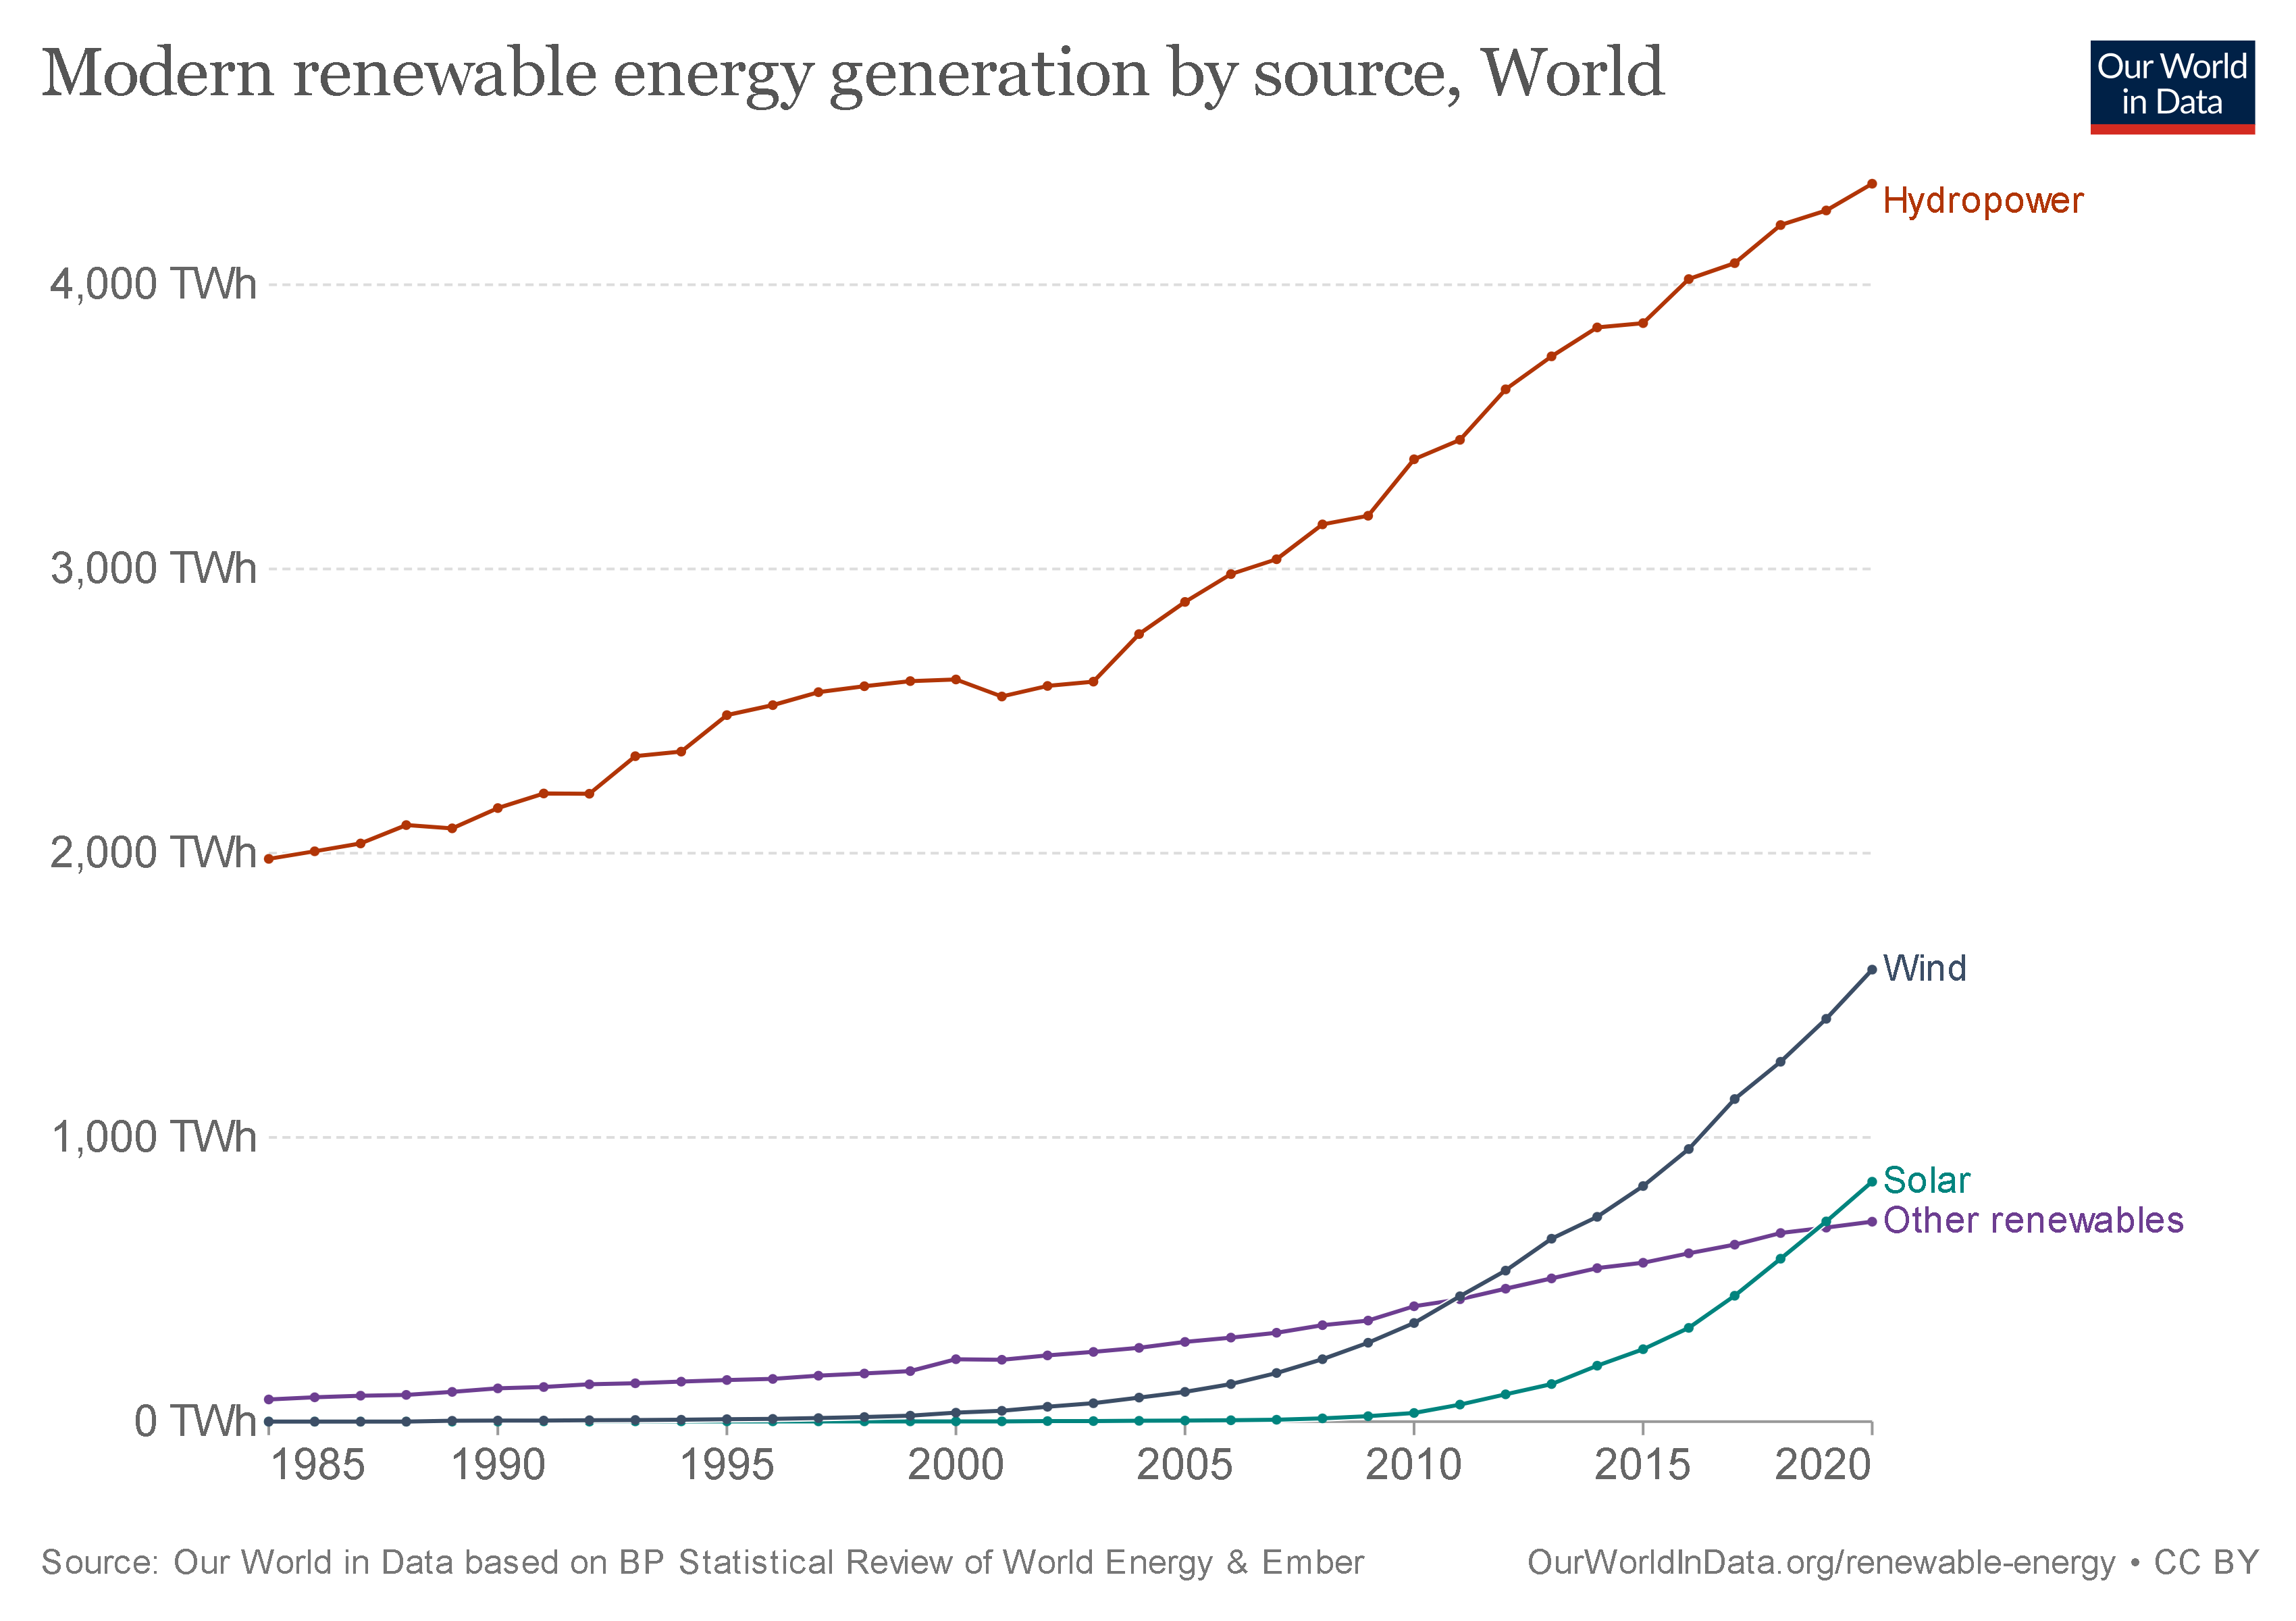
As can be seen in the graph, the demand and supply of energy-related products have increased between the years 2010 and 2020. This has had a positive effect on the industry.
Also, these are the most exciting investments for people who want to profit from innovative industries and make their own (small) contribution to preserving the environment.
Also, Check –
Largest Renewable Energy Companies
These investments are not as well known as popular funds like Facebook or Amazon, but they have the potential to be a huge win for anyone looking to gain exposure to this growing sector of the green economy.
| Stock | Price | Industry | Marketcap | Change % | Change | Volume | 52 Week Range | EPS | Dividend Rate | Dividend Yield | Country | Last Updated |
|---|---|---|---|---|---|---|---|---|---|---|---|---|
 Tesla, Inc. TSLA | $180.0 | 574.0B | 1.80% | $3.3 | 91,800,378 | 3.9 | 0.0 | 0.0% | 8 hours ago | |||
 GE Aerospace GE | $159.7 | 174.8B | 1.31% | $2.1 | 4,774,782 | 3.8 | 0.5 | 0.3% | 8 hours ago | |||
 EDP RENOVAVEIS EDPR.LS | $13.7 | 14.1B | 1.76% | $0.2453 | 1,283,856 | 0.3 | 0.0 | 0.0% | 1 day ago | |||
Enphase Energy, Inc. ENPH | $105.2 | 14.3B | 3.31% | $3.6 | 4,344,847 | 1.9 | 0.0 | 0.0% | 8 hours ago | |||
 CHINA LONGYUAN 0916.HK | $0.7107 | 15.2B | 0.91% | $0.0064 | 8,557,913 | 0.8 | 0.2 | 4.0% | 16 mins ago | |||
 SolarEdge Technologies, Inc. SEDG | $58.1 | 3.3B | 0.94% | $0.55 | 2,115,871 | 0.6 | 0.0 | 0.0% | 8 hours ago | |||
 Algonquin Power & Utilities Cor AQN | $6.3 | 4.3B | 2.29% | $0.14 | 6,068,902 | 0.0 | 0.4 | 7.1% | 8 hours ago | |||
ACCIONA, S.A. ANA.MC | $115.9 | 6.3B | 2.51% | $3.0 | 3,710 | 9.9 | 4.9 | 4.3% | 2 days ago | |||
 GOLDWIND 2208.HK | $0.4052 | 4.0B | 0.63% | $0.0026 | 1,308,600 | 0.1 | 0.1 | 3.2% | 15 mins ago | |||
 DONGFANG ELECTRIC CORPORATION L 600875.SS | $2.3 | 6.9B | 2.09% | $0.0497 | 37,504,476 | 1.1 | 0.5 | 2.8% | 2 days ago | |||
 BROOKFIELD RENEWABLE PARTNERS L BEP-UN.TO | $23.4 | 15.5B | 11.45% | $2.4 | 1,104,772 | 0.4 | 1.4 | 4.7% | 8 hours ago | |||
 First Solar, Inc. FSLR | $177.6 | 19.0B | 0.73% | $1.3 | 2,368,001 | 7.7 | 0.0 | 0.0% | 8 hours ago | |||
 NextEra Energy Partners, LP NEP | $28.6 | 2.7B | 0.88% | $0.25 | 1,268,834 | 1.3 | 3.5 | 12.3% | 8 hours ago | |||
 Sunrun Inc. RUN | $10.1 | 2.2B | 2.14% | $0.22 | 10,184,710 | 7.4 | 0.0 | 0.0% | 8 hours ago | |||
 ChargePoint Holdings, Inc. CHPT | $1.4 | 601.2M | 6.77% | $0.09 | 12,805,361 | 1.2 | 0.0 | 0.0% | 8 hours ago | |||
Enviva Inc. EVA | $0.5298 | 39.5M | 3.82% | $0.0195 | 479,808 | 4.9 | 0.9 | 177.3% | 8 hours ago | |||
NEOEN NEOEN.PA | $30.7 | 4.7B | 3.03% | $0.96 | 399,696 | 0.9 | 0.2 | 0.5% | 2 days ago | |||
 Ormat Technologies, Inc. ORA | $65.7 | 4.0B | 2.99% | $1.9 | 358,188 | 2.1 | 0.5 | 0.8% | 8 hours ago | |||
Clearway Energy, Inc. CWEN | $23.3 | 4.6B | 0.21% | $0.05 | 1,249,841 | 0.7 | 1.5 | 6.6% | 8 hours ago | |||
Atlantica Sustainable Infrastru AY | $20.9 | 2.4B | 6.90% | $1.4 | 1,633,454 | 0.4 | 1.8 | 9.1% | 8 hours ago | |||
 Hannon Armstrong Sustainable In HASI | $24.4 | 2.8B | 2.32% | $0.58 | 1,405,540 | 1.4 | 1.6 | 6.3% | 8 hours ago | |||
Ballard Power Systems, Inc. BLDP | $2.7 | 802.6M | 1.14% | $0.03 | 2,889,553 | 0.5 | 0.0 | 0.0% | 8 hours ago | |||
SunPower Corporation SPWR | $2.1 | 365.0M | 0.97% | $0.02 | 5,024,497 | 1.3 | 0.0 | 0.0% | 8 hours ago | |||
BORALEX INC BRLXF | $19.8 | 2.2B | 0.00% | $0.0000 | 94 | 0.6 | 0.7 | 3.3% | 3 weeks ago | |||
ENLIGHT RENEWABLE ENLT.TA | $16.3 | 0.0192B | 0.91% | $0.1473 | 248,077 | 2.2 | 0.0 | 0.0% | 13 hours ago | |||
Renewable Energy Group, Inc. REGI | $61.5 | 3.1B | 0.00% | $0.0000 | 2,345,177 | 3.7 | 0.0 | 0.0% | 2 years ago | |||
TERNA ENERGY S.A. (CR) TENERGY.AT | $19.5 | 2.2B | 0.71% | $0.1387 | 131,158 | 0.1 | 0.0 | 0.0% | 2 days ago | |||
Canadian Solar Inc. CSIQ | $16.4 | 1.1B | 0.86% | $0.14 | 965,948 | 3.9 | 0.0 | 0.0% | 8 hours ago | |||
SUZLON ENERGY LTD SUZLON.NS | $0.4982 | 6.8B | 0.00% | $0.0000 | 30,499,283 | 0.5 | 0.0 | 0.0% | 12 seconds ago | |||
CGRN | $0.0000 | 0.0000 | 0.00% | $0.0000 | 0 | 0.0 | 0.0 | 0.0% | 54 years ago |
Best Renewable Energy ETF’s
There is no way to predict which clean energy companies will perform well in the future. However, you can increase your exposure to the industry’s overall success by investing in ETFs, which reflect the overall performance of all stocks in a given index, rather than just a few companies’ performances.
| Name | Symbol | Current price | AUM ($M) | Expense Ratio | 3-Year Daily Total Return |
|---|---|---|---|---|---|
| iShares Global Clean Energy ETF | ICLN | $13.3 | 5660 | 0.42% | 30.25% |
| Invesco Solar ETF | TAN | $40.3 | 2670 | 0.66% | 44.62% |
| Invesco WilderHill Clean Energy ETF | PBW | $20.4 | 1410 | 0.61% | 32.02% |
| ALPS Clean Energy ETF | ACES | $27.1 | 834 | 0.55% | 30.69% |
| SPDR S&P Kensho Clean Power ETF | CNRG | $58.6 | 290 | 0.45% | 38.25% |
| Invesco Global Clean Energy ETF | PBD | $13.5 | 292 | 0.75% | 26.70% |
| VanEck Vectors Low Carbon Energy ETF | SMOG | $96.2 | 273 | 0.62% | 30.57% |
Related Post –
Disclaimer
The information on this website is only for educational benefit. It should not be considered a substitute for investment advice. Before investing, carefully consider the fund’s investment objectives, risks, charges, and expenses.
Your second table is broken. Click on AUM and the rows are sorted according to the first digit of AUM, not by the entire numeric value. So, for example, 300 sorts before 40 when sorting in ascending order.
Edited 🙂 Thanks