
| 52 Week Range | 52 Weeks Low | 52 Weeks High |
|---|---|---|
| ₹ 18,060.40 | ₹ 22,794.70 |
Nifty 50 Stocks List (2023)
The NIFTY 50™ index is a well-diversified benchmark that reflects overall market conditions, with 50 of the top stocks representing domestic companies listed on the (NSE) National Stock Exchange. It is designed to be a high-quality representative index that reflects the stock market as a whole.
The NIFTY 50 Stocks/Index offers greater choice, enabling investors to increase their exposure and hedge against market risks by selecting an appropriate number of stocks from sectors or industries.
Here is the complete and updated list of Nifty 50 Companies with all details.
Also, Check –
| Stock | Price | Change % | Change | Marketcap | Volume | EPS | Dividend Rate | Dividend Yield | Shares | Sector | Industry | 52 Week Range | Last Updated | Type | Currency |
|---|---|---|---|---|---|---|---|---|---|---|---|---|---|---|---|
 RELIANCE INDS RELIANCE.NS | ₹ 2,868.00 | 2.22% | ₹ 65.10 | 19.41T | 8,612,811 | 102.96 | 10.00 | 0.34% | 6,766,110,208 | 2 days ago | EQUITY | INR | |||
 TATA CONSULTANCY S TCS.NS | ₹ 3,843.40 | 0.52% | ₹ 19.90 | 13.91T | 2,961,551 | 126.06 | 55.00 | 1.42% | 3,618,089,984 | 2 days ago | EQUITY | INR | |||
 HDFC BANK HDFCBANK.NS | ₹ 1,519.60 | 0.83% | ₹ 12.65 | 11.55T | 15,928,395 | 88.74 | 19.50 | 1.27% | 7,601,589,760 | 2 days ago | EQUITY | INR | |||
 INFOSYS LTD INFY.NS | ₹ 1,416.30 | 0.13% | ₹ 1.85 | 5.86T | 8,840,569 | 63.45 | 0.46 | 0.03% | 4,140,610,048 | 2 days ago | EQUITY | INR | |||
HINDUSTAN UNILEVER HINDUNILVR.NS | ₹ 2,217.05 | 0.42% | ₹ 9.25 | 5.21T | 2,594,455 | 43.68 | 42.00 | 1.89% | 2,349,590,016 | 2 days ago | EQUITY | INR | |||
ICICI BANK ICICIBANK.NS | ₹ 1,142.05 | 0.23% | ₹ 2.60 | 8.02T | 19,932,282 | 62.01 | 10.00 | 0.88% | 7,025,540,096 | 2 days ago | EQUITY | INR | |||
HOUSING DEVEL FIN HDFC.NS | ₹ 2,732.00 | 0.28% | ₹ 7.70 | 5.06T | 42,365,041 | 142.59 | 44.00 | 1.62% | 1,851,430,016 | 10 months ago | EQUITY | INR | |||
 BHARTI AIRTEL LTD BHARTIARTL.NS | ₹ 1,277.40 | 2.04% | ₹ 26.65 | 7.59T | 11,289,815 | 14.56 | 4.00 | 0.31% | 5,670,419,968 | 2 days ago | EQUITY | INR | |||
BAJAJ FINANCE LTD BAJFINANCE.NS | ₹ 6,931.50 | 0.71% | ₹ 48.80 | 4.28T | 6,817,378 | 235.67 | 36.00 | 0.52% | 618,008,000 | 2 days ago | EQUITY | INR | |||
 STATE BK OF INDIA SBIN.NS | ₹ 831.45 | 0.17% | ₹ 1.40 | 7.42T | 22,663,316 | 71.50 | 0.00 | 0.00% | 8,924,609,536 | 2 days ago | EQUITY | INR | |||
 KOTAK MAHINDRA BAN KOTAKBANK.NS | ₹ 1,546.70 | 1.84% | ₹ 28.95 | 3.07T | 16,122,602 | 87.54 | 0.00 | 0.00% | 1,987,929,984 | 2 days ago | EQUITY | INR | |||
 WIPRO LTD WIPRO.NS | ₹ 457.35 | 0.01% | ₹ 0.05 | 2.39T | 4,863,714 | 21.45 | 1.00 | 0.22% | 5,221,239,808 | 2 days ago | EQUITY | INR | |||
HCL TECHNOLOGIES HCLTECH.NS | ₹ 1,348.05 | 0.93% | ₹ 12.65 | 3.65T | 5,963,446 | 57.83 | 0.62 | 0.05% | 2,707,990,016 | 2 days ago | EQUITY | INR | |||
 ASIAN PAINTS LTD ASIANPAINT.NS | ₹ 2,929.75 | 1.53% | ₹ 45.65 | 2.81T | 1,593,975 | 56.84 | 26.40 | 0.89% | 958,841,984 | 2 days ago | EQUITY | INR | |||
ITC LTD ITC.NS | ₹ 436.45 | 0.58% | ₹ 2.55 | 5.45T | 22,901,781 | 16.41 | 13.00 | 2.96% | 12,484,700,160 | 2 days ago | EQUITY | INR | |||
BAJAJ FINSERV LTD BAJAJFINSV.NS | ₹ 1,627.30 | 0.73% | ₹ 11.85 | 2.59T | 5,226,028 | 50.77 | 1.00 | 0.06% | 1,593,270,016 | 2 days ago | EQUITY | INR | |||
 LARSEN & TOUBRO LT.NS | ₹ 3,499.80 | 2.77% | ₹ 99.70 | 4.81T | 4,077,497 | 90.99 | 0.00 | 0.00% | 1,374,669,952 | 2 days ago | EQUITY | INR | |||
 MARUTI SUZUKI IND MARUTI.NS | ₹ 12,492.15 | 2.45% | ₹ 313.20 | 3.93T | 834,935 | 397.25 | 125.00 | 0.98% | 314,403,008 | 2 days ago | EQUITY | INR | |||
 ULTRATECH CEMENT ULTRACEMCO.NS | ₹ 9,816.30 | 1.67% | ₹ 167.15 | 2.83T | 516,934 | 222.83 | 70.00 | 0.70% | 288,184,992 | 2 days ago | EQUITY | INR | |||
AXIS BANK AXISBANK.NS | ₹ 1,141.50 | 0.73% | ₹ 8.35 | 3.52T | 9,992,651 | 85.04 | 1.00 | 0.09% | 3,087,439,872 | 2 days ago | EQUITY | INR | |||
TITAN COMPANY LTD TITAN.NS | ₹ 3,533.90 | 0.97% | ₹ 34.55 | 3.13T | 1,680,925 | 38.90 | 0.00 | 0.00% | 887,062,016 | 2 days ago | EQUITY | INR | |||
NESTLE INDIA NESTLEIND.NS | ₹ 2,456.10 | 2.24% | ₹ 56.20 | 2.37T | 1,128,694 | 30.70 | 25.76 | 1.03% | 964,156,992 | 2 days ago | EQUITY | INR | |||
 OIL & NATURAL GAS ONGC.NS | ₹ 286.10 | 1.17% | ₹ 3.30 | 3.60T | 28,907,895 | 33.33 | 10.25 | 3.62% | 12,580,299,776 | 2 days ago | EQUITY | INR | |||
SUN PHARMACEUTICAL SUNPHARMA.NS | ₹ 1,511.15 | 0.52% | ₹ 7.85 | 3.63T | 3,182,920 | 37.17 | 12.50 | 0.82% | 2,399,330,048 | 2 days ago | EQUITY | INR | |||
TATA MOTORS LTD. TATAMOTORS.NS | ₹ 1,013.40 | 1.40% | ₹ 14.40 | 3.72T | 11,870,951 | 50.67 | 0.00 | 0.00% | 3,323,739,904 | 2 days ago | EQUITY | INR | |||
 JSW STEEL LTD JSWSTEEL.NS | ₹ 874.20 | 1.81% | ₹ 16.15 | 2.13T | 3,672,132 | 46.07 | 0.00 | 0.00% | 2,436,499,968 | 2 days ago | EQUITY | INR | |||
ADANI PORT SPECIAL ADANIPORTS.NS | ₹ 1,320.30 | 1.38% | ₹ 18.50 | 2.85T | 3,526,559 | 39.61 | 6.00 | 0.45% | 2,160,140,032 | 2 days ago | EQUITY | INR | |||
TECH MAHINDRA TECHM.NS | ₹ 1,250.45 | 1.30% | ₹ 16.45 | 1.22T | 2,322,173 | 26.63 | 40.00 | 3.16% | 976,801,984 | 2 days ago | EQUITY | INR | |||
TATA STEEL LTD TATASTEEL.NS | ₹ 166.50 | 0.51% | ₹ 0.85 | 2.08T | 62,537,923 | 2.75 | 0.00 | 0.00% | 12,483,500,032 | 2 days ago | EQUITY | INR | |||
 POWER GRID CORP POWERGRID.NS | ₹ 310.85 | 0.88% | ₹ 2.75 | 2.89T | 27,071,745 | 17.35 | 12.06 | 3.85% | 9,300,599,808 | 2 days ago | EQUITY | INR | |||
HDFC LIFE INSURANC HDFCLIFE.NS | ₹ 565.90 | 1.81% | ₹ 10.45 | 1.22T | 8,570,679 | 7.30 | 2.00 | 0.35% | 2,150,400,000 | 2 days ago | EQUITY | INR | |||
NTPC LTD NTPC.NS | ₹ 364.95 | 1.11% | ₹ 4.10 | 3.54T | 26,838,093 | 18.58 | 7.50 | 2.03% | 9,696,669,696 | 2 days ago | EQUITY | INR | |||
 DIVI'S LABORATORIE DIVISLAB.NS | ₹ 3,950.95 | 0.35% | ₹ 13.70 | 1.05T | 348,101 | 52.15 | 0.00 | 0.00% | 265,468,992 | 2 days ago | EQUITY | INR | |||
SBI LIFE INSURANCE SBILIFE.NS | ₹ 1,443.25 | 1.21% | ₹ 17.65 | 1.45T | 1,354,845 | 18.91 | 2.70 | 0.18% | 1,001,470,016 | 2 days ago | EQUITY | INR | |||
 GRASIM INDUSTRIES GRASIM.NS | ₹ 2,481.35 | 1.81% | ₹ 44.00 | 1.68T | 1,191,714 | 85.36 | 0.00 | 0.00% | 656,358,016 | 2 days ago | EQUITY | INR | |||
MAHINDRA &MAHINDRA M&M.NS | ₹ 2,193.00 | 0.36% | ₹ 7.85 | 2.63T | 3,859,091 | 0.00 | 0.00 | 0.00% | 1,197,970,048 | 2 days ago | EQUITY | INR | |||
HINDALCO INDS HINDALCO.NS | ₹ 647.10 | 0.88% | ₹ 5.65 | 1.45T | 10,633,758 | 42.19 | 0.00 | 0.00% | 2,236,940,032 | 2 days ago | EQUITY | INR | |||
BAJAJ AUTO LTD BAJAJ-AUTO.NS | ₹ 9,105.60 | 0.06% | ₹ 5.05 | 2.54T | 395,870 | 272.26 | 80.00 | 0.88% | 279,180,000 | 2 days ago | EQUITY | INR | |||
 COAL INDIA LTD COALINDIA.NS | ₹ 474.60 | 4.56% | ₹ 20.70 | 2.92T | 51,055,960 | 60.70 | 0.00 | 0.00% | 6,162,729,984 | 2 days ago | EQUITY | INR | |||
BRITANNIA INDS BRITANNIA.NS | ₹ 4,744.60 | 0.32% | ₹ 15.05 | 1.14T | 262,488 | 89.48 | 0.00 | 0.00% | 240,868,000 | 2 days ago | EQUITY | INR | |||
BHARAT PETROL CORP BPCL.NS | ₹ 629.85 | 0.76% | ₹ 4.80 | 1.37T | 4,498,198 | 135.92 | 0.00 | 0.00% | 2,169,250,048 | 2 days ago | EQUITY | INR | |||
DR REDDYS LABS DRREDDY.NS | ₹ 6,349.55 | 0.99% | ₹ 62.05 | 1.06T | 581,243 | 313.03 | 40.00 | 0.64% | 166,528,000 | 2 days ago | EQUITY | INR | |||
INDUSIND BANK LTD INDUSINDBK.NS | ₹ 1,483.70 | 1.43% | ₹ 21.50 | 1.15T | 2,118,412 | 115.28 | 16.50 | 1.10% | 778,358,016 | 2 days ago | EQUITY | INR | |||
CIPLA LTD CIPLA.NS | ₹ 1,424.75 | 0.33% | ₹ 4.70 | 1.15T | 804,424 | 45.88 | 0.00 | 0.00% | 807,395,008 | 2 days ago | EQUITY | INR | |||
TATA CONSUMER PRODUCT LTD TATACONSUM.NS | ₹ 1,094.30 | 0.29% | ₹ 3.15 | 1.04T | 2,935,675 | 12.37 | 7.75 | 0.71% | 952,835,008 | 2 days ago | EQUITY | INR | |||
 EICHER MOTORS EICHERMOT.NS | ₹ 4,599.25 | 0.07% | ₹ 3.15 | 1.26T | 562,483 | 139.82 | 0.00 | 0.00% | 273,806,016 | 2 days ago | EQUITY | INR | |||
UPL LIMITED UPL.NS | ₹ 493.60 | 0.92% | ₹ 4.60 | 370.50B | 2,196,632 | 7.65 | 0.00 | 0.00% | 750,608,000 | 2 days ago | EQUITY | INR | |||
HERO MOTOCORP LTD HEROMOTOCO.NS | ₹ 4,552.75 | 0.19% | ₹ 8.75 | 910.24B | 347,485 | 180.74 | 110.00 | 2.41% | 199,931,008 | 2 days ago | EQUITY | INR | |||
ADANI ENTERPRISES ADANIENT.NS | ₹ 2,993.25 | 1.52% | ₹ 46.35 | 3.41T | 1,471,187 | 27.24 | 1.30 | 0.04% | 1,140,000,000 | 2 days ago | EQUITY | INR | |||
APOLLO HOSPITALS. APOLLOHOSP.NS | ₹ 6,009.60 | 0.86% | ₹ 51.05 | 864.09B | 563,789 | 54.69 | 15.00 | 0.25% | 143,784,992 | 2 days ago | EQUITY | INR |
Nifty 50 Companies By Weight
As an investor, when people search for Nifty 50, they also want to know the weight of each company. So that they can understand how much impact each stock carries and help them decide where to invest their money.
| No | Company Name | Sector | Weight |
|---|---|---|---|
| 1 | Reliance Industries Ltd. | Petroleum Products | 10.28% |
| 2 | HDFC Bank Ltd. | Banks | 8.73% |
| 3 | ICICI Bank Ltd. | Banks | 8.15% |
| 4 | HDFC Ltd. | Finance | 5.88% |
| 5 | Infosys Ltd. | Information Technology | 5.79% |
| 6 | ITC Ltd. | Consumer Non Durables | 4.83% |
| 7 | Tata Consultancy Services Ltd. | Information Technology | 4.15% |
| 8 | Kotak Mahindra Bank Ltd | Financial Services | 3.68% |
| 9 | Larsen & Toubro Ltd. | Construction | 3.28% |
| 10 | Axis Bank Ltd. | Banks | 3.08% |
| 11 | Hindustan Unilever Ltd. | Consumer Non Durables | 2.93% |
| 12 | State Bank of India | Banks | 2.74% |
| 13 | Bharti Airtel Ltd. | Telecom - Services | 2.56% |
| 14 | Bajaj Finance Ltd. | Banks | 2.29% |
| 15 | Asian Paints Limited | Consumer Non Durables | 1.77% |
| 16 | Maruti Suzuki India Limited | Auto | 1.53% |
| 17 | HCL Techno. Ltd. | Software | 1.49% |
| 18 | Titan Company Ltd. | Consumer Durables | 1.45% |
| 19 | Mahindra & Mahindra Ltd. | Auto | 1.45% |
| 20 | Sun Pharma. Industries Ltd. | Pharmaceuticals | 1.3% |
| 21 | Tata Motors Ltd. | Auto | 1.14% |
| 22 | UltraTech Cement Limited | Cement & Cement Products | 1.12% |
| 23 | Tata Steel Ltd. | Ferrous Metals | 1.05% |
| 24 | Indusind Bank Ltd. | Banks | 1.03% |
| 25 | NTPC Limited | Power | 1.02% |
| 26 | Power Grid Corp. of India Ltd. | Power | 0.98% |
| 27 | Bajaj Finserv Ltd. | Insurance | 0.97% |
| 28 | Nestle India Ltd. | Consumer Non Durables | 0.95% |
| 29 | Tech Mahindra Ltd. | Software | 0.86% |
| 30 | Adani Enterprises Ltd | Metals & Mining | 0.84% |
| 31 | JSW Steel Ltd. | Ferrous Metals | 0.81% |
| 32 | Grasim Industries Ltd. | Cement & Cement Products | 0.78% |
| 33 | Oil & Natural Gas Corporation Ltd. | Oil | 0.74% |
| 34 | Wipro Ltd. | Information Technology | 0.74% |
| 35 | Hindalco Industries Ltd. | Non - Ferrous Metals | 0.73% |
| 36 | HDFC Life Insurance Company Ltd. | Financial Services | 0.72% |
| 37 | Adani Ports & Special Economic Zone | Transpor. | 0.69% |
| 38 | Britannia Industries Ltd. | Consumer Non Durables | 0.68% |
| 39 | SBI Life Insurance Company Ltd. | Insurance | 0.68% |
| 40 | Dr Reddys Laboratories Ltd. | Pharma. | 0.67% |
| 41 | Bajaj Auto Limited | Auto | 0.64% |
| 42 | Coal India Ltd. | Minerals | 0.62% |
| 43 | Cipla Ltd. | Pharma. | 0.62% |
| 44 | Eicher Motors Ltd. | Auto | 0.62% |
| 45 | Tata Consumer Products Limited | Consumer Non Durables | 0.58% |
| 46 | Apollo Hospitals Enterprise Ltd. | Healthcare | 0.57% |
| 47 | Divi’s Laboratories Ltd. | Cement & Cement Products | 0.54% |
| 48 | UPL Ltd. | Pesticides | 0.44% |
| 49 | Hero MotoCorp Ltd. | Auto | 0.44% |
| 50 | Bharat Petroleum Corporation Ltd. | Petroleum Products | 0.43% |
Related Post –
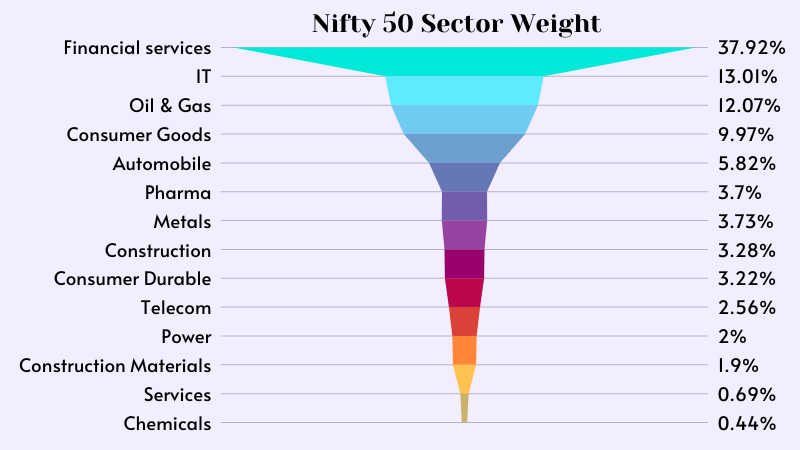
Nifty 50 Sector By Weight
In Nifty – Financial Services (36.96%) and the IT sector (17.84%) cover more than half the weight of the overall index. Also Oil & Gas contain 12.15%, Consumer goods have 10.83% and the rest part covered by other sectors.
Frequently Asked Questions
The Nifty 50 is the Index of the top 50 Indian large-cap companies which is also known as the benchmark of the Indian economy. The index holds more than 65% market capitalization of the stock market with 14 different sectors & market leaders.
-> Market impact cost is the best measure of the liquidity of a stock. It accurately reflects the costs faced when actually trading an index. For a stock to qualify for possible inclusion into the NIFTY50, has traded at an average impact cost of 0.50% or less during the last six months for 90% of the observations, for the basket size of Rs. 100 Million.
-> The company should have a listing history of 6 months.
-> Companies that are allowed to trade in the F&O segment are only eligible to be constituents of the index.
-> A company that comes out with an IPO will be eligible for inclusion in the index if it fulfills the normal eligibility criteria for the index for a 3-month period instead of a 6-month period
The Nifty 50 Index is managed by the India Index Services and Products Ltd. (IISL), which is a joint venture between NSE and CRISIL.
The 50 stocks in the nifty index are weighted by market capitalization. For this reason, investors cannot directly invest in the nifty index; they can invest in either an index fund or an exchange-traded fund (ETF).
Many people think that index funds are the simplest way to invest in equity. They offer a relatively low risk, clear investment strategy, and better returns than any fixed deposit and 90% of mutual funds.
Disclaimer For Investors ✋
The information described on this site is not intended to be investment advice. The past performance of a fund is no guarantee of future results. Before investing you should carefully consider the Fund’s investment objectives, risks, and charges.