P/E Ratio
S&P 500
Nasdaq 100
Dow Jones
Fortune 100
Inflation
10-Year Yield
Crypto
Bitcoin Prediction
Ethereum Prediction
Cardano Prediction
Solana Prediction
Matic Prediction
Dogecoin Prediction
VeChain Prediction
Stories
P/E Ratio
S&P 500
Nasdaq 100
Dow Jones
Fortune 100
Inflation
10-Year Yield
Crypto
Bitcoin Prediction
Ethereum Prediction
Cardano Prediction
Solana Prediction
Matic Prediction
Dogecoin Prediction
VeChain Prediction
Stories
Search
Search
Finasko- Track Stock Market & Learn Trading
Top 13 Artificial Intelligence Stocks (2023)
7 months ago
7 months ago
ARKQ Holdings List 2023 | Performance, Stock Weight & Dividend
7 months ago
7 months ago
ARKF Holdings List 2023 | Performance, Stock Weight & Dividend
7 months ago
7 months ago
VIX Index: Measure Stock Market Volatility (CBOE Volatility Index)
7 months ago
7 months ago
6 High Paying Dividend ETFs For 2023
7 months ago
7 months ago
ARKW Holdings List 2023 | Performance, Stock Weight & Dividend
7 months ago
7 months ago
Dividend Aristocrats List 2023 (All 68 Stocks by Dividend Yield)
7 months ago
7 months ago
ARKX Stock Holdings List (2023): Price, Weight & Performance
7 months ago
7 months ago
ARKG Holdings List 2023 | Performance, Stock Weight & Dividend
7 months ago
7 months ago
4
2023 – World’s Top 25 Internet Companies By Market Cap
7 months ago
7 months ago
How to Trade with Candlestick Chart (Ultimate Guide 2023)
7 months ago
7 months ago
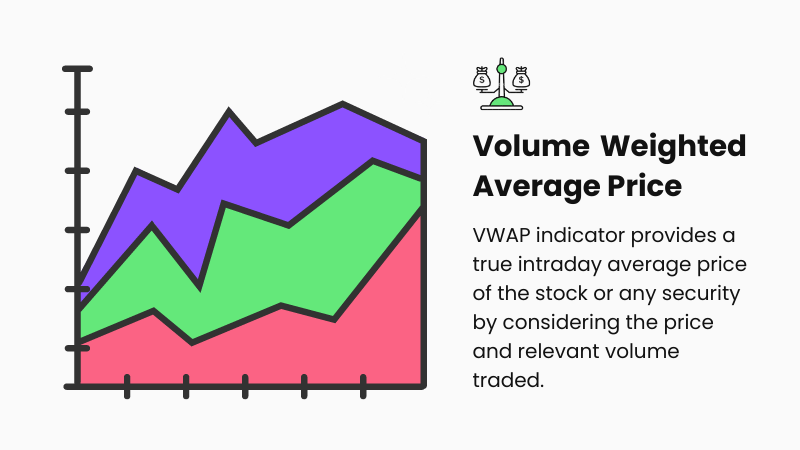
How to Trade with VWAP (Best Day Trading Strategies 2023)
7 months ago
7 months ago
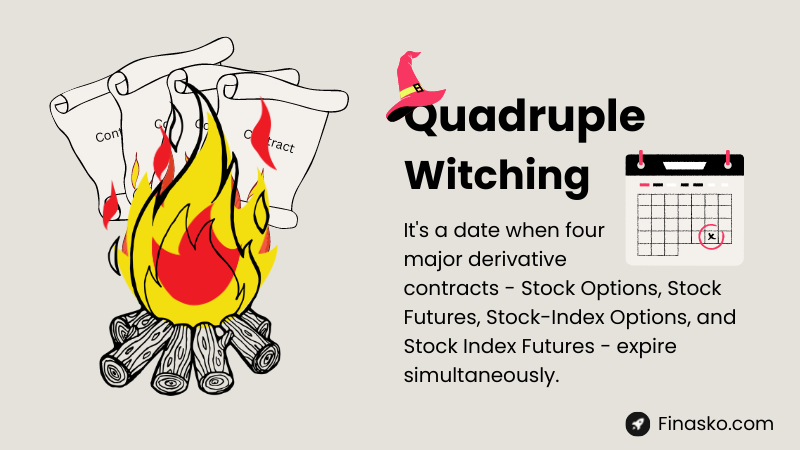
Quad or Triple Witching in 2023 (Ultimate Guide)
7 months ago
7 months ago
Bank Nifty Stocks List By Weight & Market Cap (June 2023)
7 months ago
7 months ago
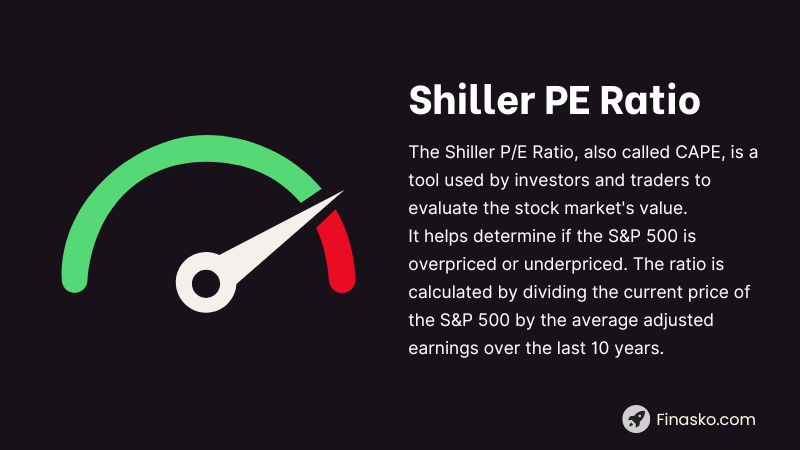
S&P 500 Shiller CAPE Ratio (Cyclically Adjusted PE Ratio 2023)
7 months ago
7 months ago
Top 30 Stocks in Dow Jones Index (2023)
7 months ago
7 months ago
2
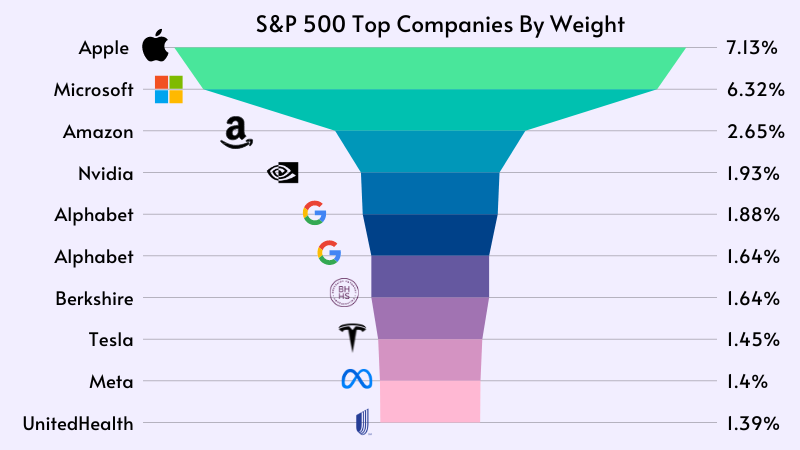
S&P 500 Companies (Updated List 2023)
7 months ago
7 months ago
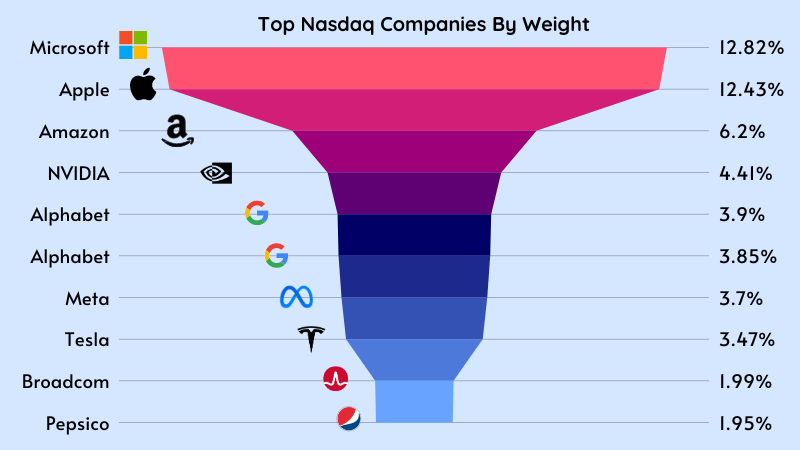
Nasdaq 100 Companies (Updated List 2023)
7 months ago
7 months ago
Load more
log in
Remember me
log in
Forgot password?
forgot password
reset